.svg)

.svg)


Morning Star vs. Bullish Abandoned Baby
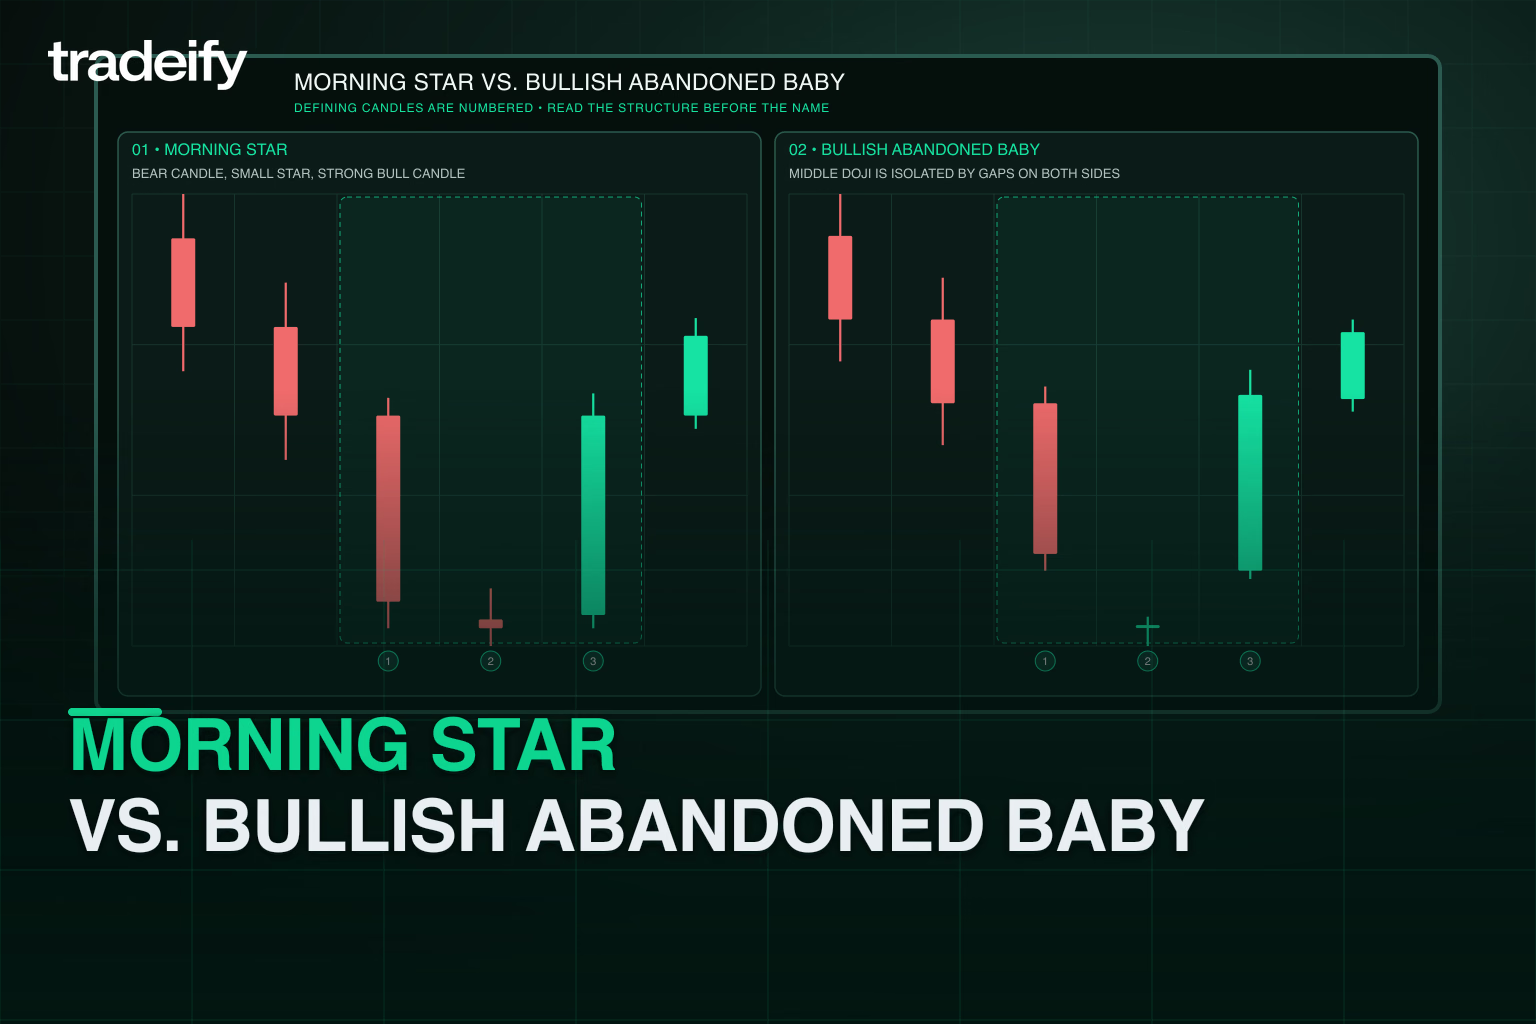
Some less common names fit the same framework. A bullish abandoned baby is a three-candle reversal with a doji isolated by gaps in the traditional version.

.svg)
Bullish candlestick patterns can flag a reversal, but context and confirmation decide if a setup is tradable. Learn formations, triggers, and invalidation.
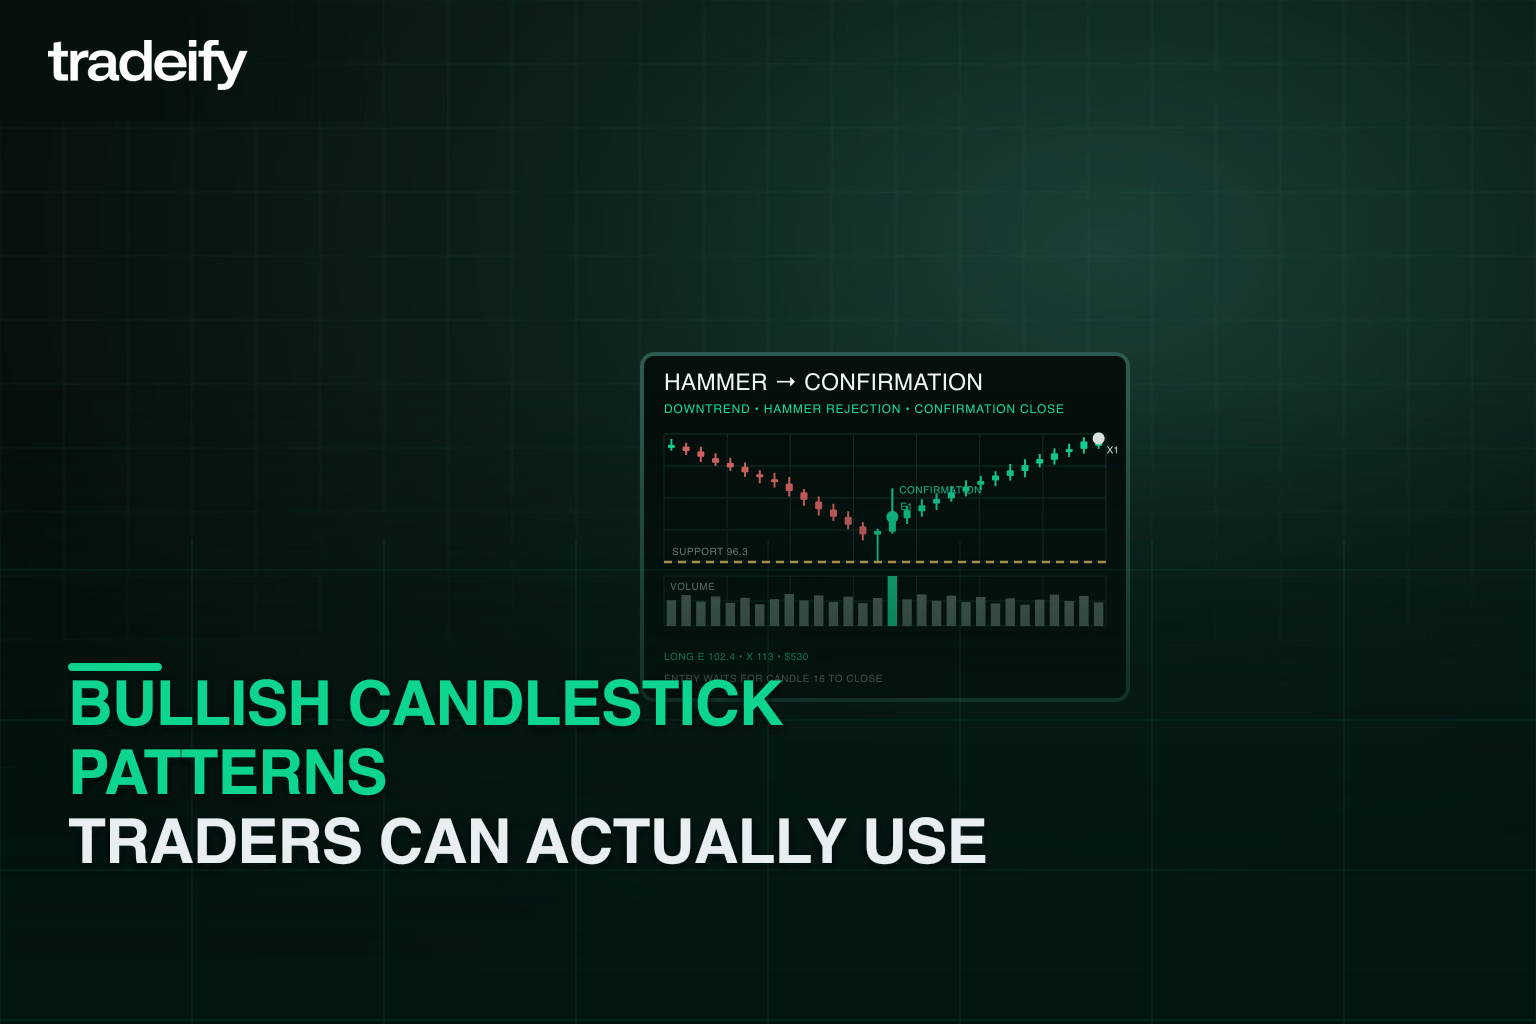
TL;DR: Bullish candlestick patterns can show that selling pressure is weakening, but a pattern is not a confirmed reversal by itself. Start with the prior downtrend or pullback, mark support, wait for the candle or full pattern to close, define a trigger, and decide where the setup is invalid before entering. Common formations include the hammer, inverted hammer, bullish engulfing, piercing line, morning star, tweezer bottom, dragonfly doji, bullish harami, and three white soldiers. Location and follow-through matter more than the pattern name. Test the exact definition on the market and timeframe you actually trade before risking money on it.
A hammer prints after a sharp selloff. It looks clean, buyers defended the low, and the temptation is to enter before the next candle gets away.
That is exactly where traders get caught. You noticed a possible shift, but you have not confirmed one. A bullish pattern can identify a place to pay attention. It cannot tell you that buyers will keep control.
The useful question is not, “Is this candle bullish?” It is, “What would price have to do next for this setup to become tradable, and where would it be wrong?”
A bullish candlestick pattern shows a possible change in the balance between buyers and sellers. Price may reject a lower level, close above a prior candle, or build a multi-candle sequence that suggests selling pressure is slowing.
Observation comes first. Confirmation comes after.
If a hammer forms in the middle of a choppy range, the long lower wick may be nothing more than two-sided noise. If the same hammer forms after a clear decline into prior support, closes near its high, and receives follow-through, the setup has a reason behind it.
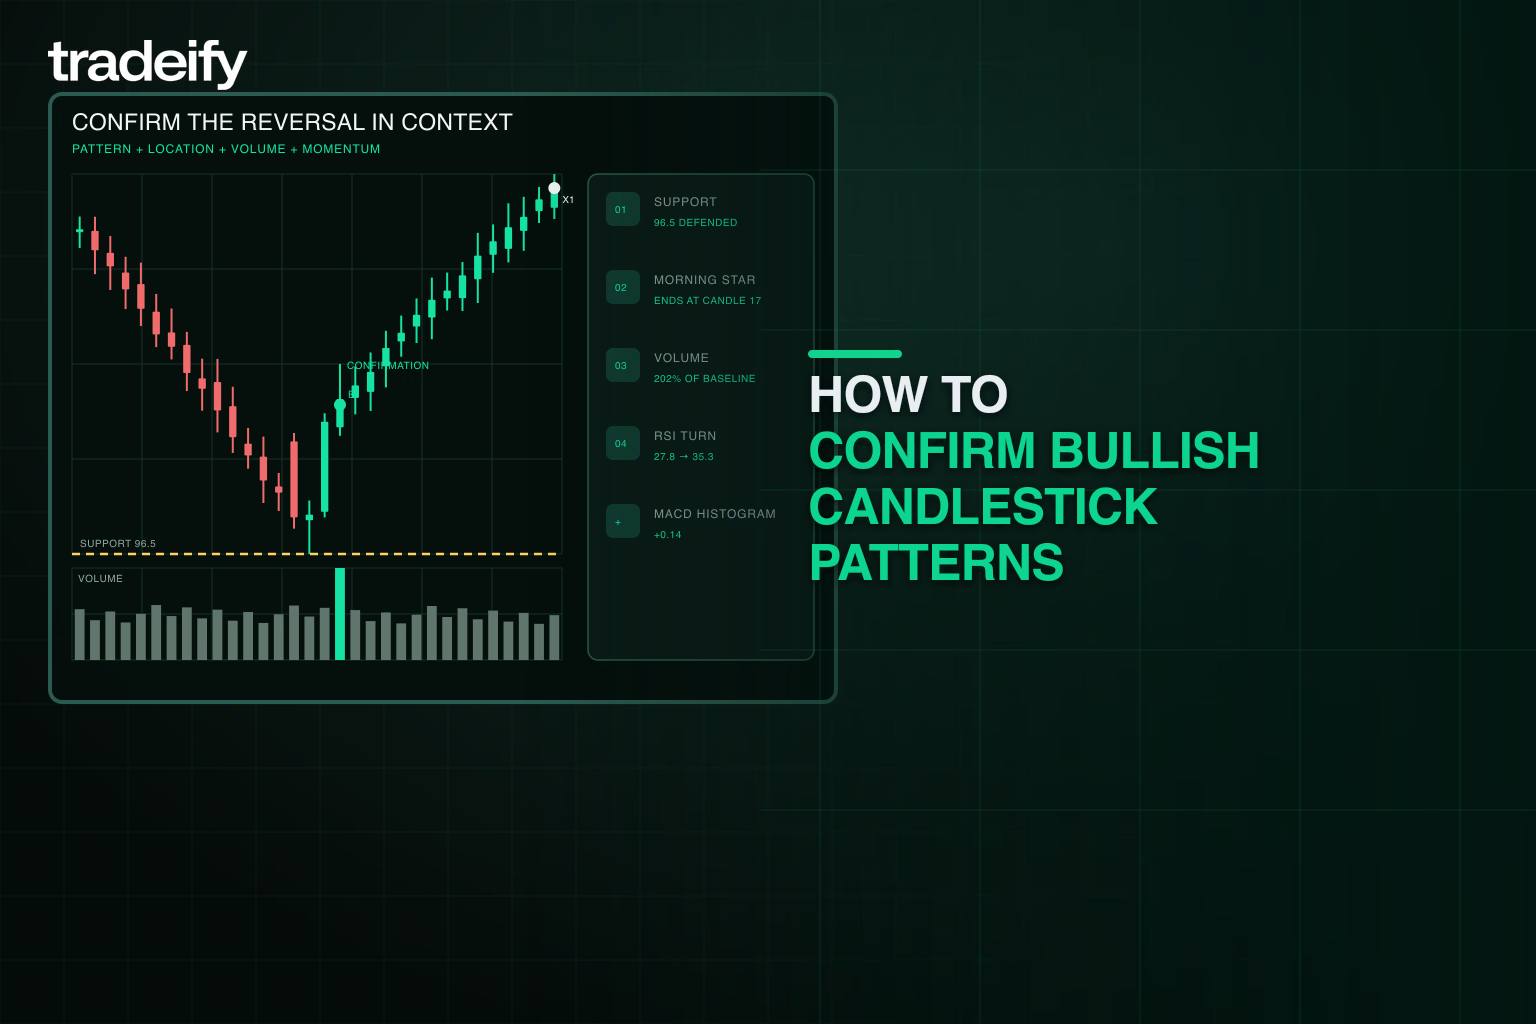
Before treating any bullish formation as a trade candidate, check four things:
Candlestick charting grew out of the Japanese rice market. Japanese traders were using a form of technical analysis to trade rice as early as the 17th century, and much of the credit for developing candlesticks goes to a rice trader named Homma from the town of Sakata. Steve Nison, who introduced candlestick charting to the Western world, places the first appearance of the method sometime after 1850. The StockCharts ChartSchool introduction to candlesticks covers that history alongside the formation rules every pattern builds on.
The method survived because a single candle compresses the four numbers that matter into one shape: the open, the high, the low, and the close. ChartSchool calls the open-to-close relationship the essence of candlesticks, since a close above the open shows buying pressure and a close below it shows selling pressure. That compression is also why bullish patterns are not tied to one market. Any chart that reports an open, high, low, and close can print a hammer, and that includes futures, forex, and crypto charts.
In practice, traders lean on bullish patterns for three jobs:
What changes between markets is the rhythm around the candles, not the candle definitions. Equity charts pause overnight and print their opens at the session bell, while index futures run a much longer session with only a short daily break. A hammer at a stock's session open and a hammer printed mid-session in an equity-index future are the same formation in very different liquidity conditions, so confirm each one against the market you actually trade. The futures market hours guide breaks down when participation is strongest.
The table below covers the main bullish formations traders study. Use it as a setup checklist, not a forecast.
| Pattern | Example | Structure | Best context | Confirmation to watch |
|---|---|---|---|---|
| Hammer | 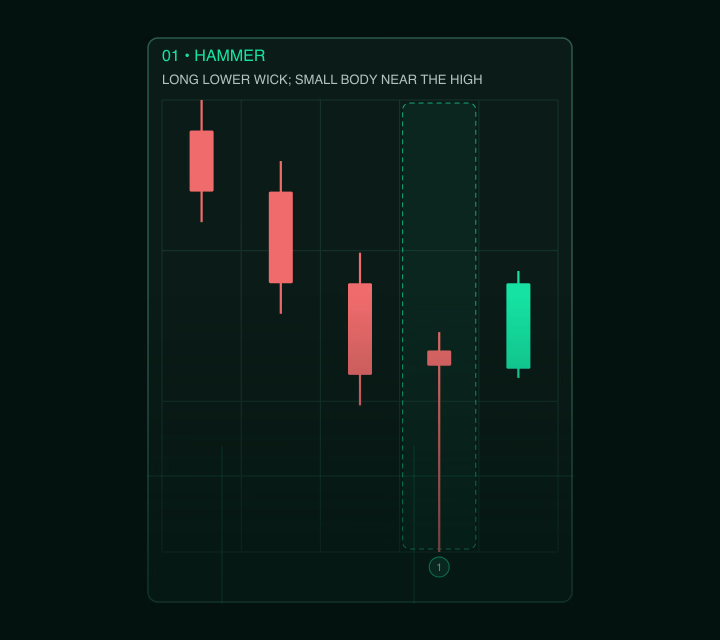 Click to enlarge Click to enlarge | Small real body near the candle high with a lower wick commonly at least twice the body length | After a selloff into support | The next candle holds the hammer low and breaks or closes above its high |
| Inverted hammer | 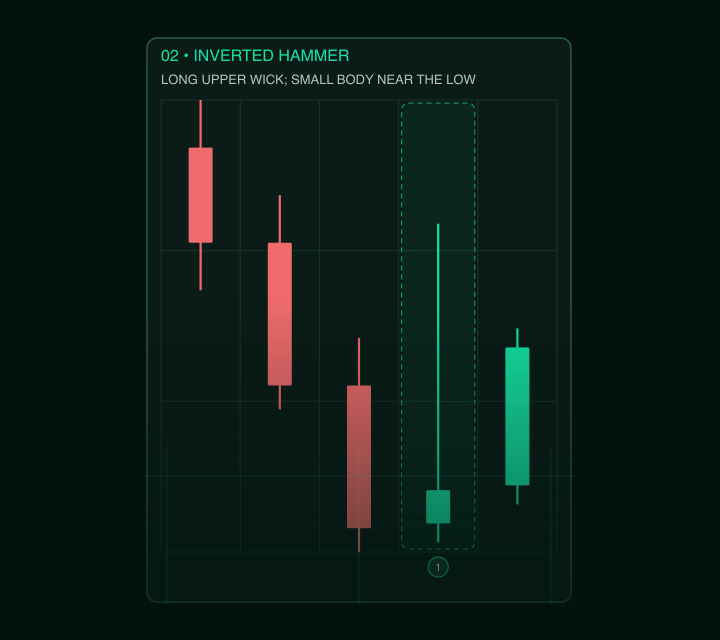 Click to enlarge Click to enlarge | Small real body near the candle low with a long upper wick | After a downtrend where buyers begin testing higher prices | A close above the inverted hammer high or clear upside follow-through |
| Bullish engulfing | 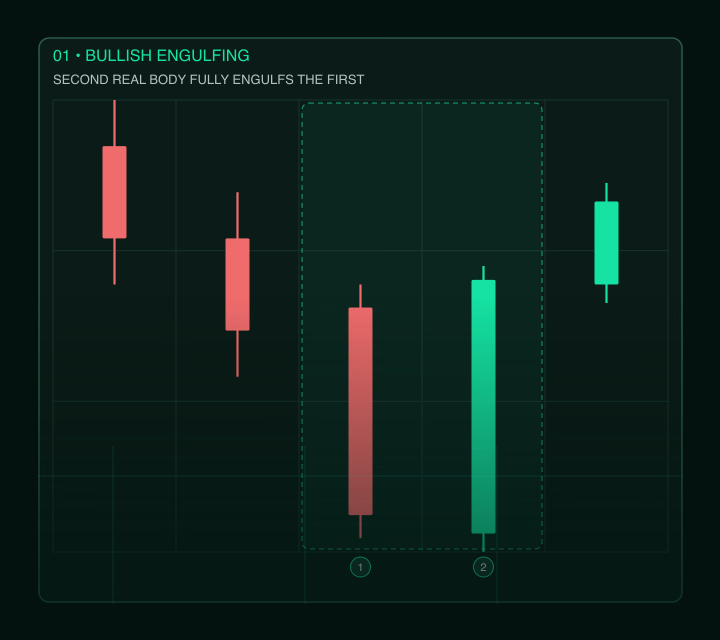 Click to enlarge Click to enlarge | A bullish real body opens at or below the prior bearish close and closes at or above the prior bearish open, engulfing the prior real body | After a pullback where sellers fail to extend lower | A hold above the engulfing close or a break of nearby resistance |
| Piercing line | 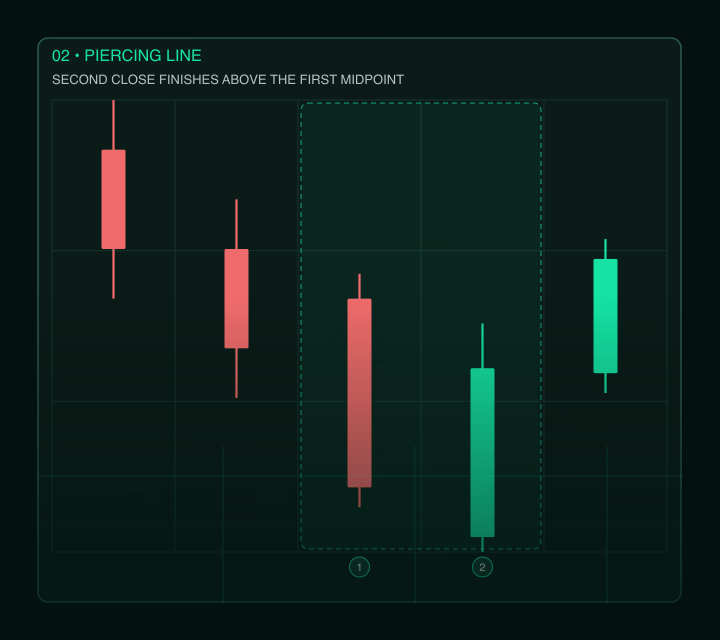 Click to enlarge Click to enlarge | A bearish candle is followed by a bullish candle that opens lower in the traditional gap-based version and closes above the midpoint of the prior bearish real body | After a defined decline | Additional buying after the second candle closes |
| Morning star | 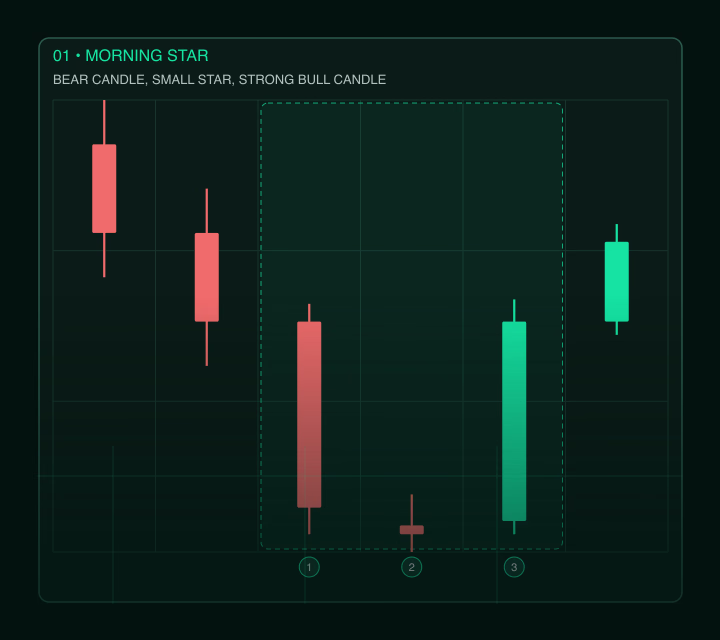 Click to enlarge Click to enlarge | A bearish candle, a small indecision candle, and a bullish candle that closes well into the first candle’s real body | After an extended decline or exhaustion move | The completed pattern low holds and price clears nearby resistance |
| Tweezer bottom | 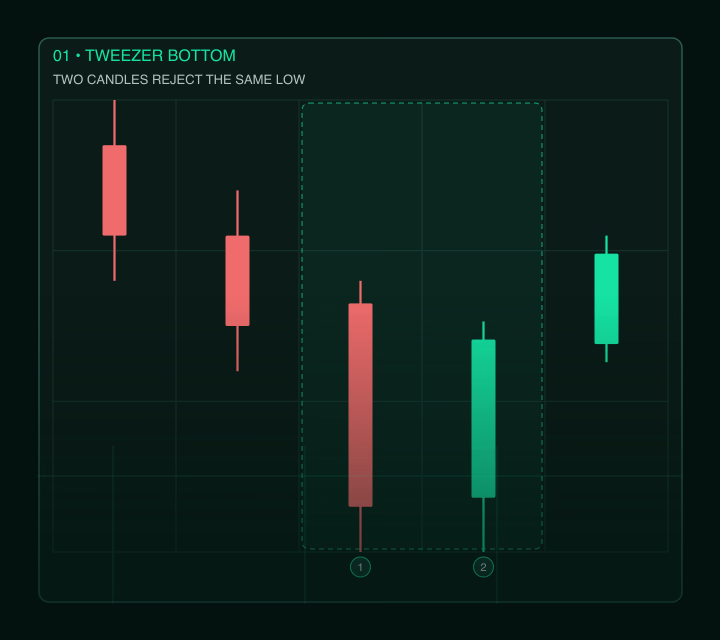 Click to enlarge Click to enlarge | Two candles print matching or nearly matching lows after a decline | At support where sellers fail on a second test | A break above the two-candle range or a successful retest of the matched low |
| Dragonfly doji | 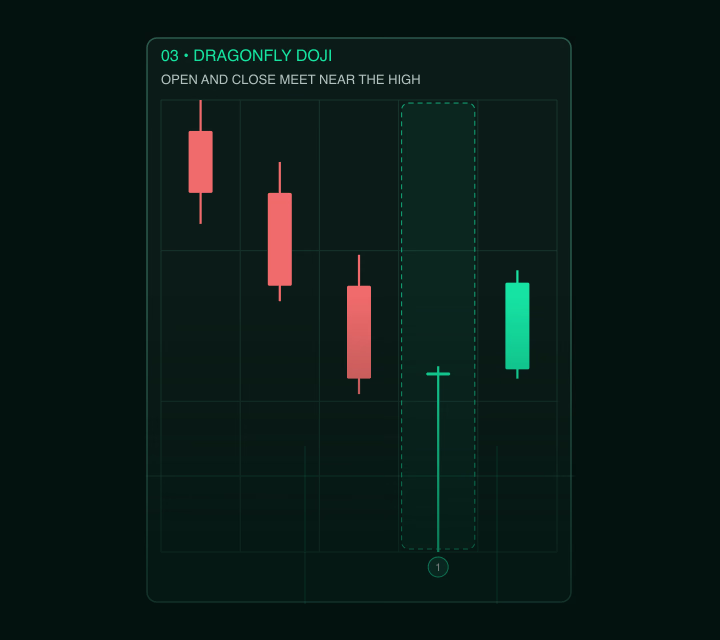 Click to enlarge Click to enlarge | Open and close sit near the candle high with a long lower wick and little or no upper wick | After a decline into support | A higher close, a higher low, or stronger participation on the next candle |
| Bullish harami | 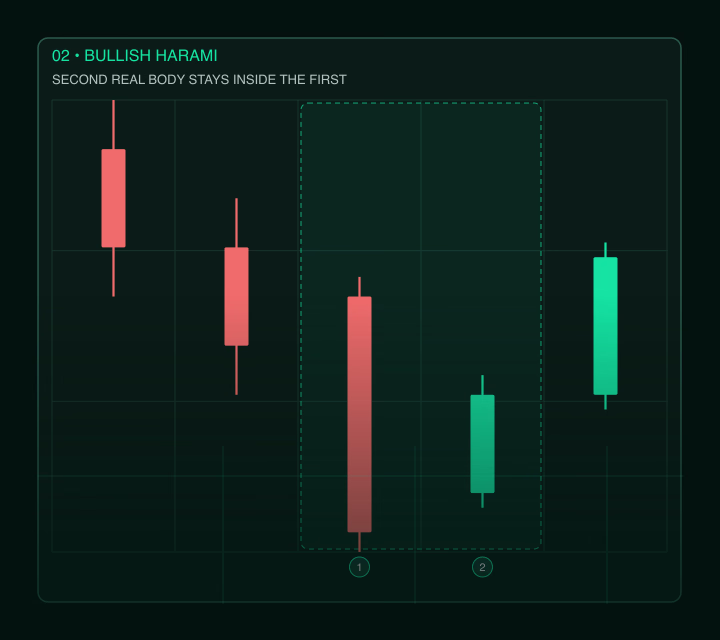 Click to enlarge Click to enlarge | A smaller bullish real body sits inside the preceding larger bearish real body | After selling pressure begins to slow | A break above the harami range with improving momentum |
| Three white soldiers | 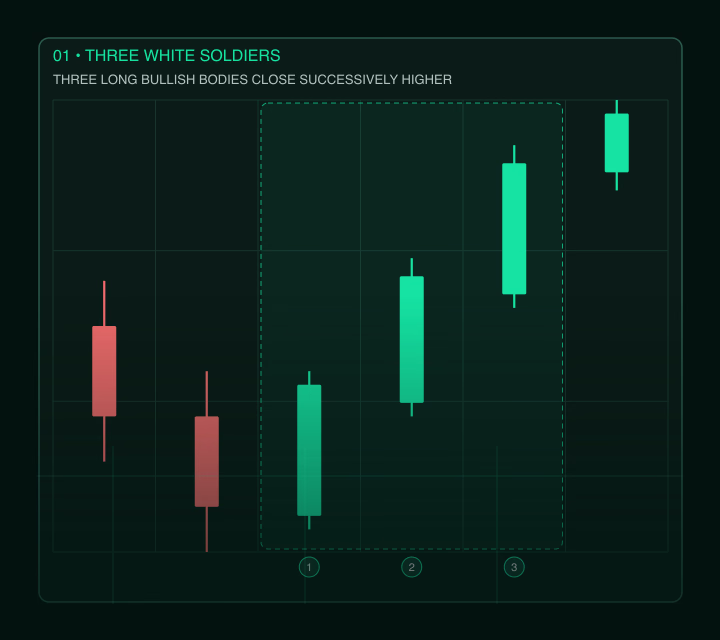 Click to enlarge Click to enlarge | Three relatively long bullish real bodies close successively higher, usually near their highs | After a base, pullback, or bearish stretch | The formation holds without an immediate rejection of the third candle |
Pattern names are useful shorthand, but they do not all ask the same question.
Some less common names fit the same framework. A bullish abandoned baby is a three-candle reversal with a doji isolated by gaps in the traditional version.
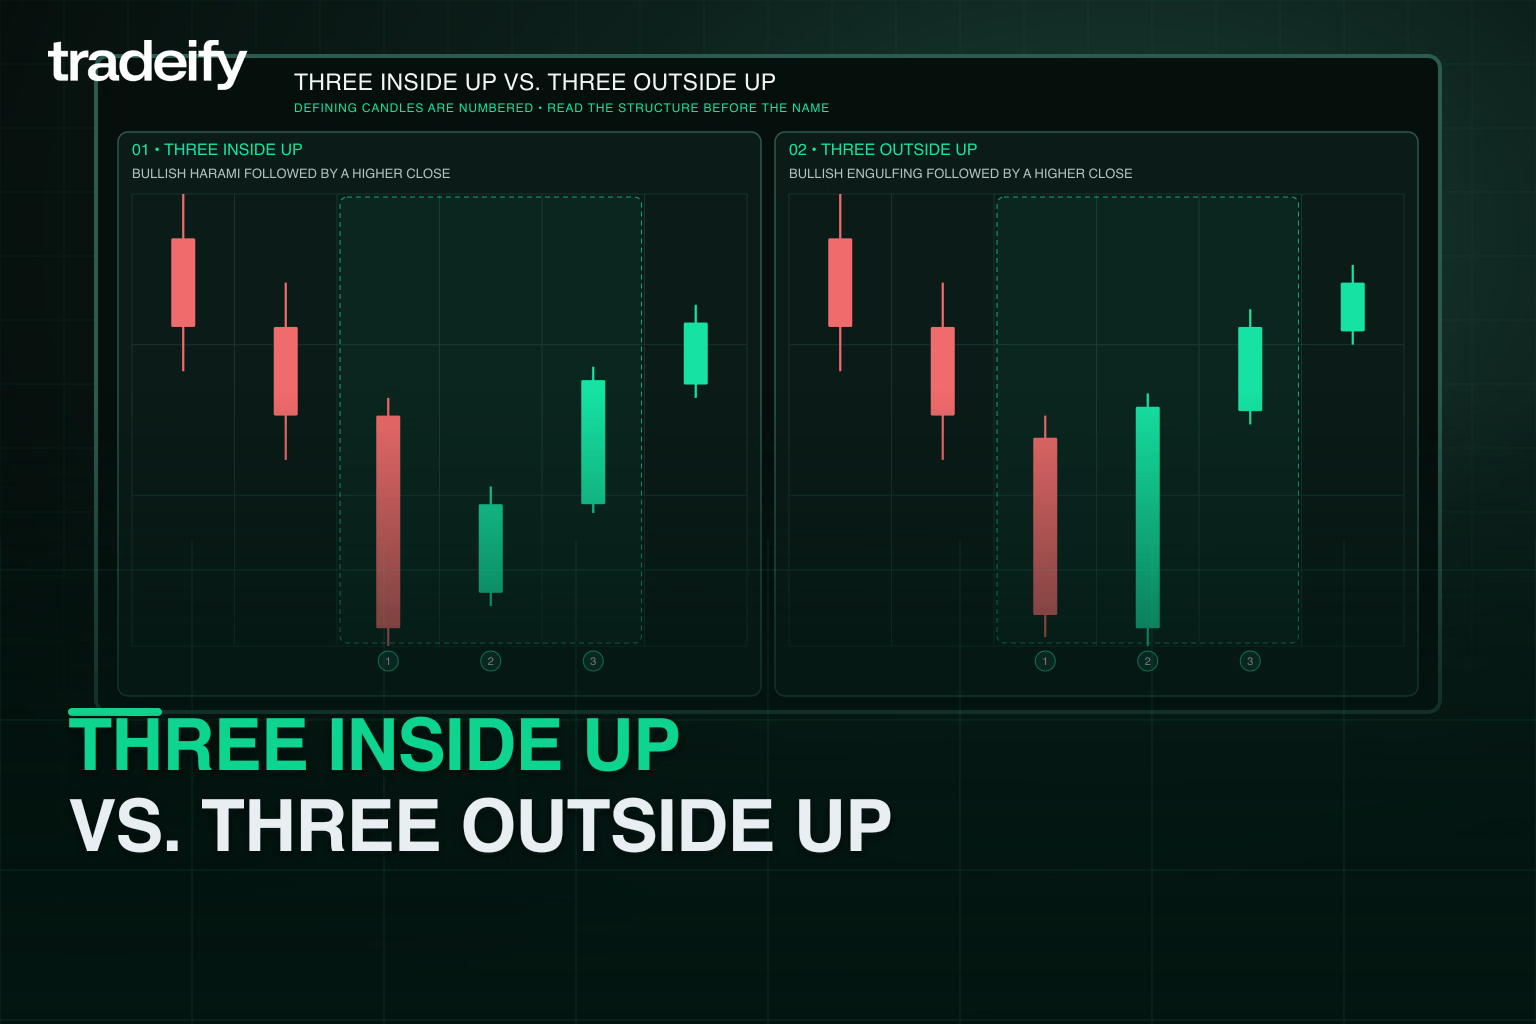
Three inside up and three outside up add a confirmation candle to harami and engulfing structures.
Rising three methods is a continuation pattern, not a bottom call.

You do not need to memorize every name. You need to recognize what sellers tried to do, how buyers responded, and whether the response changed structure.
A confirmation rule should remove a failure you see repeatedly in your charts or journal. Adding indicators because the setup feels uncertain only makes the screen busier.
Mark the level before the pattern appears. Prior swing lows, established support, VWAP, moving averages, and session levels may matter when they are part of a tested plan for that market and timeframe.
If the pattern is floating in the middle of a range, there may be no clear reason for buyers to defend that price. Waiting is a valid decision.
An unfinished candle can change shape quickly. A hammer can lose its lower-wick rejection, and an engulfing candle can close back inside the prior body.
Wait for the candle or full sequence to close. Then decide whether your trigger is a break above the pattern high, a close above nearby resistance, or a retest that holds.
Follow-through shows that the buyer response lasted longer than one candle. It may appear as a higher close, a higher low, a break above the pattern range, or stronger volume on the advance.
Momentum tools such as RSI, MACD, or stochastic readings can support the read, but they should not replace price structure. If the candle says “possible reversal” while price remains below resistance and momentum is still deteriorating, the evidence is mixed.
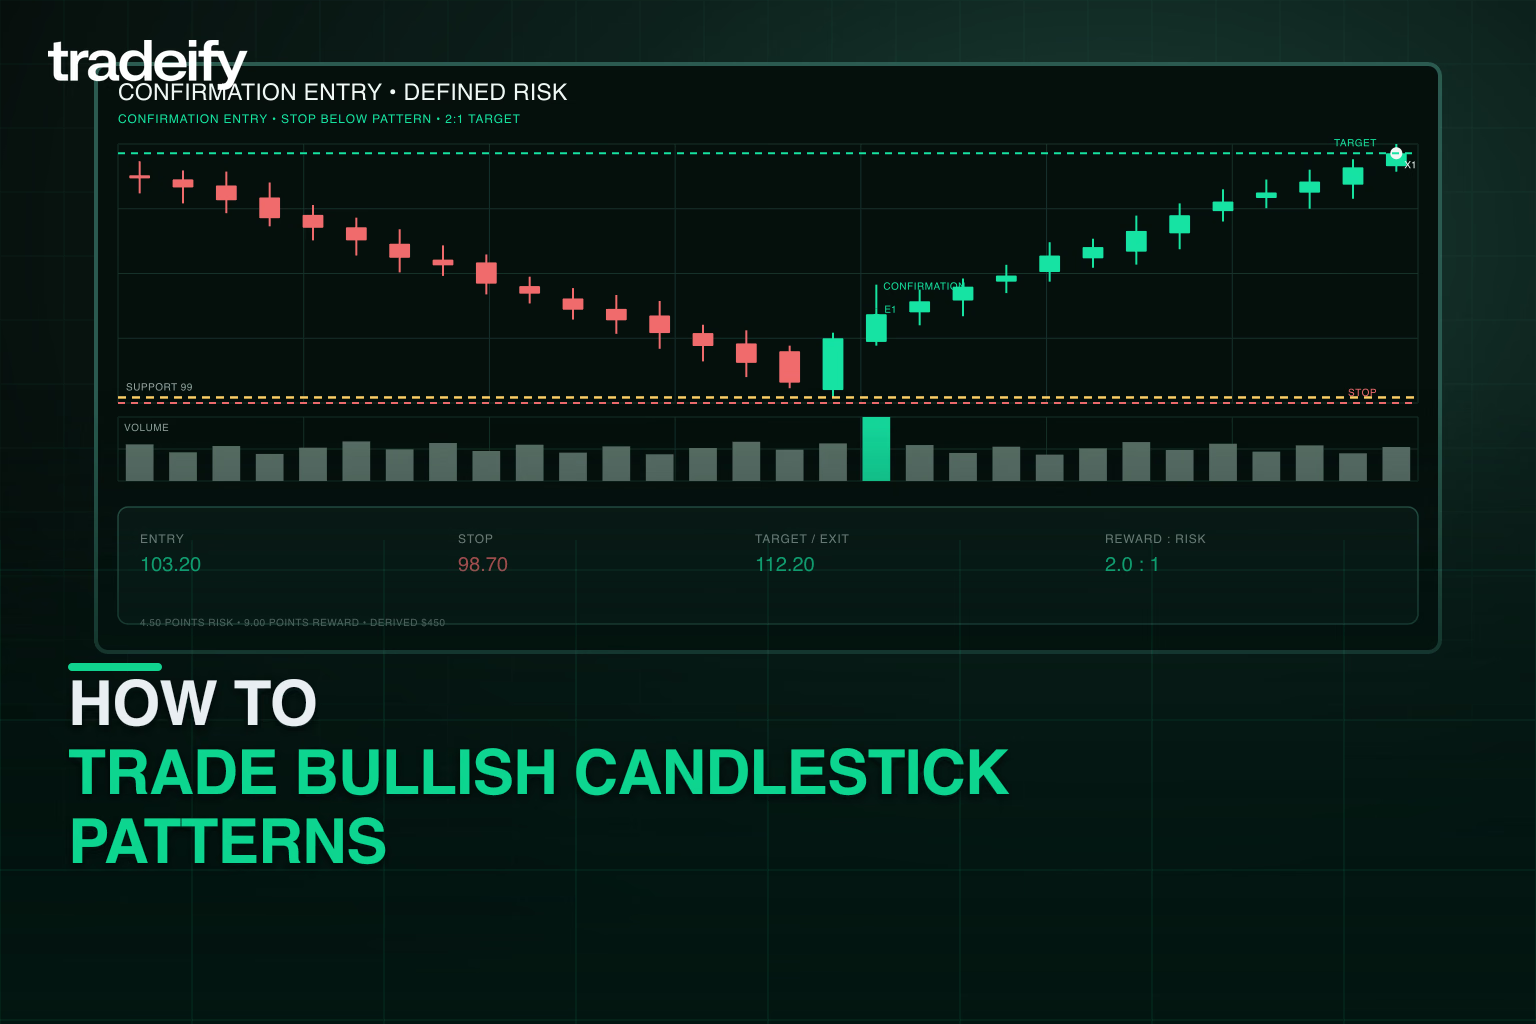
The stop belongs where the setup is wrong, not where the loss happens to feel comfortable. That may be below the pattern low, below the support zone, or beyond another structural level your plan defines.
Then check the math. If a structure-based stop leaves no reasonable path to the next target, skipping the trade is cleaner than forcing a tighter stop inside normal price noise.
Build the trade before you click. This sequence keeps a fast visual signal from becoming an improvised risk decision.
Imagine a bullish engulfing candle forms at support after a three-session decline. The observation is buyer strength. A close above the engulfing high is the confirmation. The entry follows only if the distance to the next resistance level still supports the trade. A break below the pattern low invalidates it.
The market can still stop you out. A clean loss does not mean the process failed; it means this valid setup did not produce the desired outcome.
Everything above defines a sound setup. It does not tell you whether that setup is profitable on the market you trade. A bullish candlestick pattern only becomes tradable once you test a written definition against historical data, and the test has to be strict enough to trust:
A pattern is worth trading when a full sample says the edge covers its own losses after costs. How many trades you need to backtest a strategy covers how big that sample should be, and the writeup of common backtesting mistakes shows where these tests usually go wrong.
If you trade under account rules, check the daily loss limit and remaining drawdown buffer before sizing. A technically valid setup can still be a bad account decision when the stop does not fit. You can review current account options on the Tradeify pricing page.
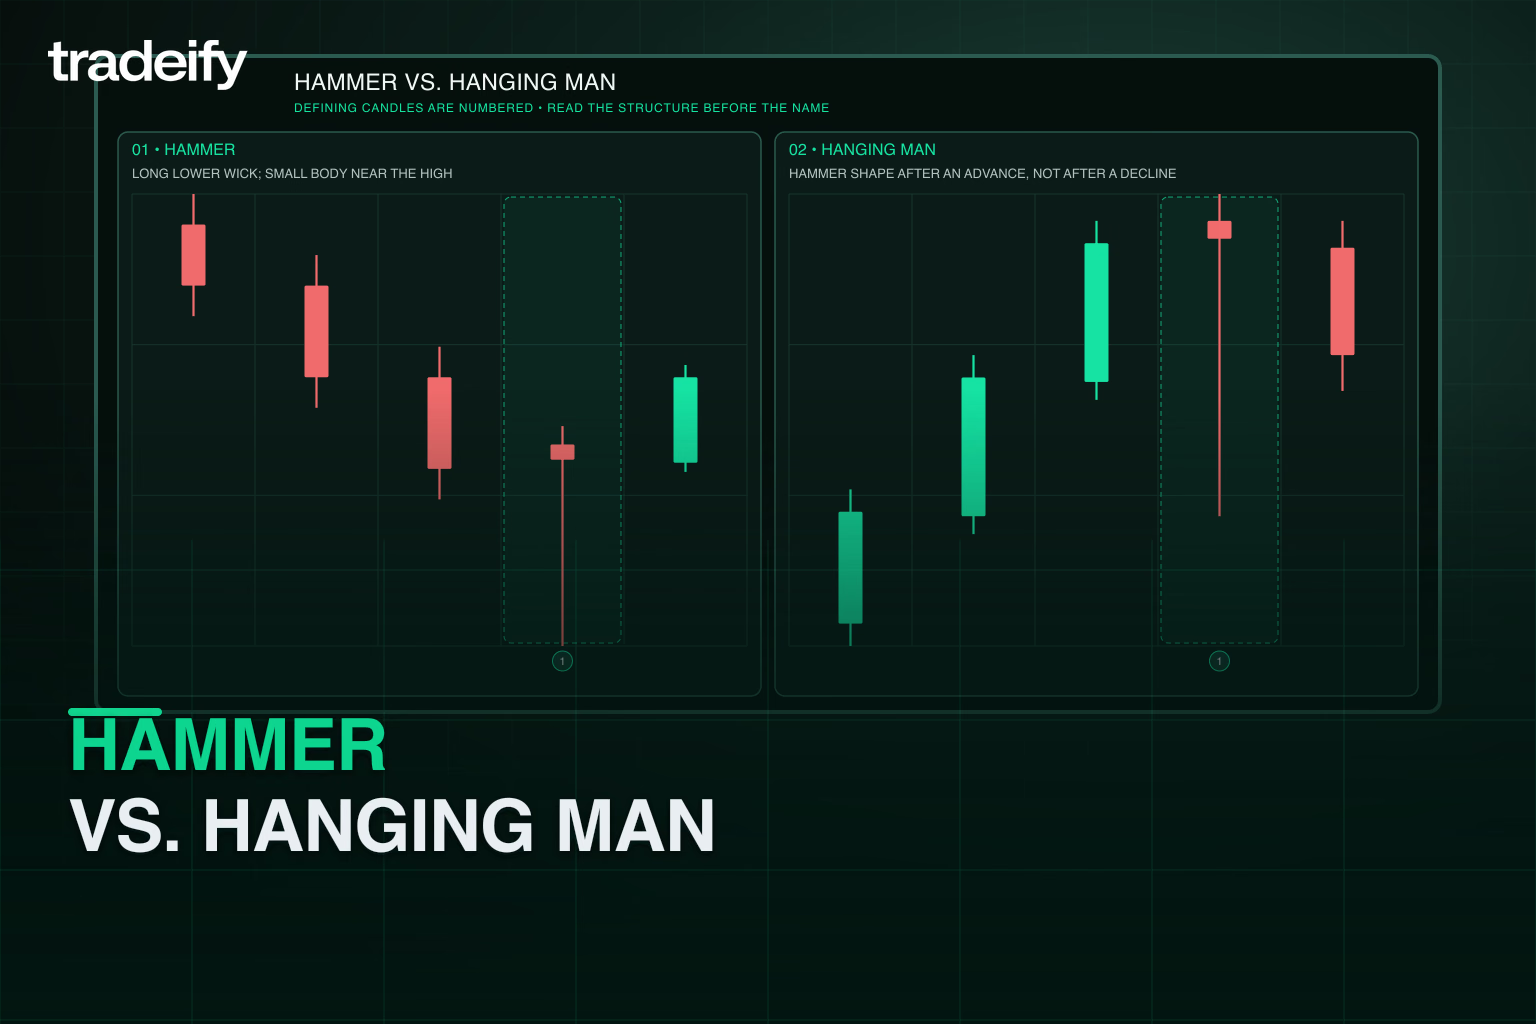
Many pattern errors come from reading the shape without reading the prior move.
The candle shape can be similar. A hammer forms after a decline and can support a bullish reversal thesis. A hanging man forms after an advance and can warn of weakness.
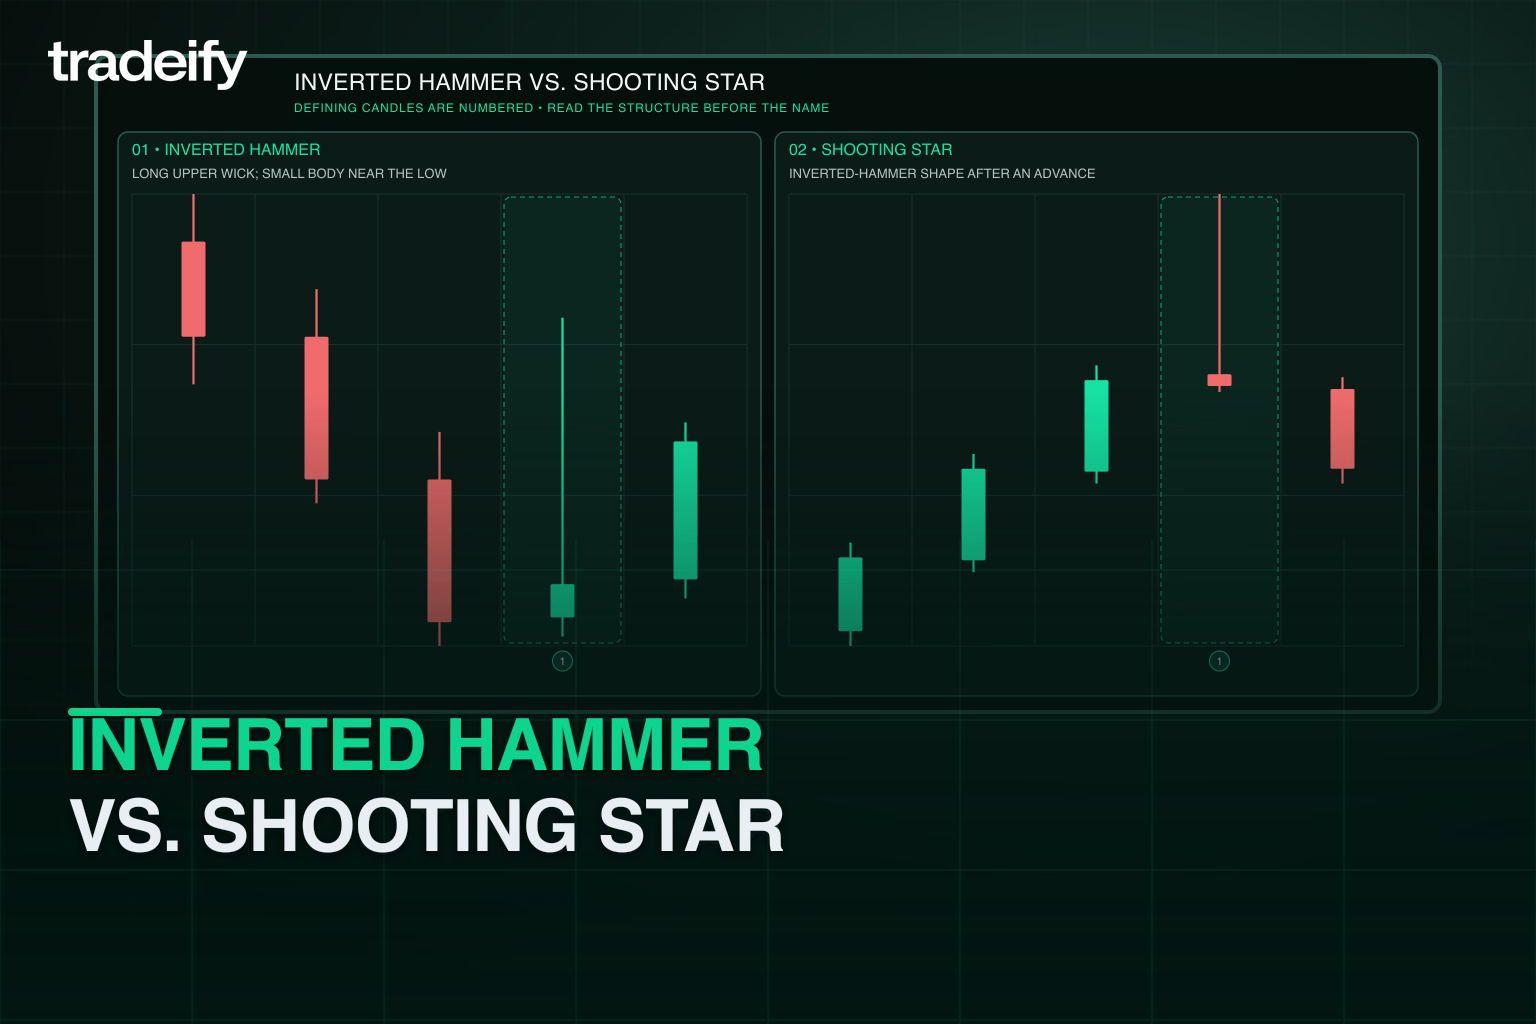
Both can have a long upper wick. An inverted hammer appears after a decline; a shooting star appears after an advance.
A standard bullish engulfing pattern requires the second real body to engulf the first real body. An outside bar also exceeds the prior high and low.
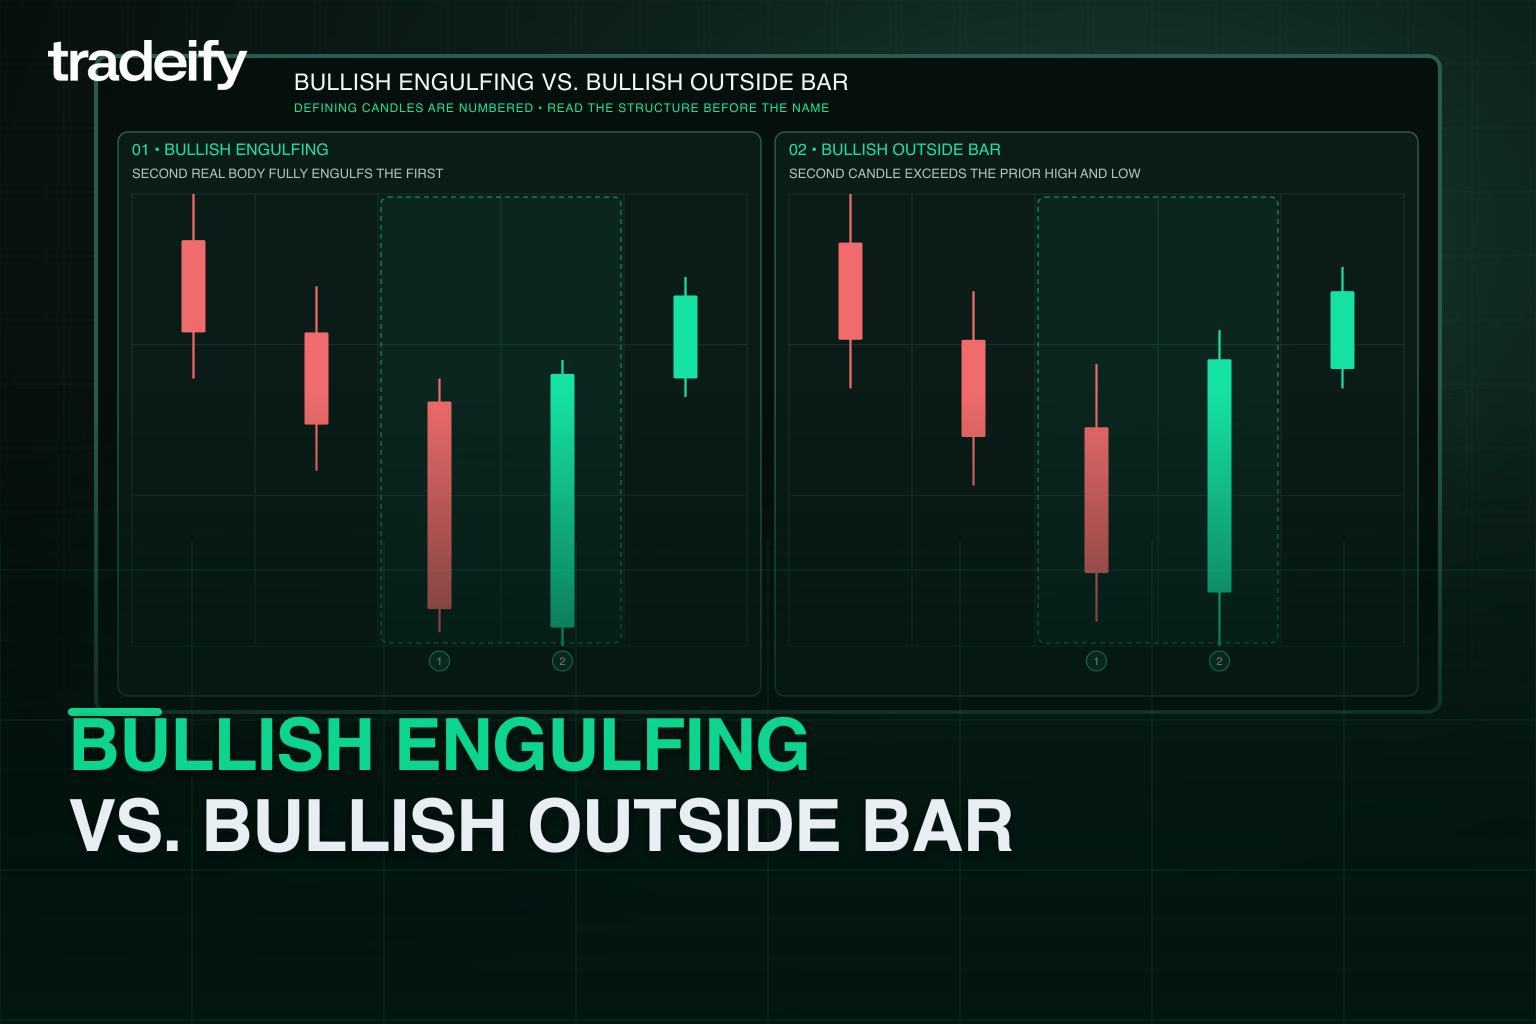
The practical rule is simple: name the prior move before naming the candle. Context changes the meaning.
In the common charting convention, bullish candles are green or white because they close above their open, while bearish candles are red or black because they close below it. The color is only a label for that open-to-close relationship, and some platforms let you change the palette, so judge the candle by where it closed relative to its open rather than by the color itself.
No pattern is the most bullish in every market. A bullish engulfing pattern, morning star, or three white soldiers formation can show a strong shift when it appears after a decline and receives confirmation. Location, follow-through, and the available reward relative to risk decide the quality of the setup.
There is no universal three-candle rule. Some strategies use three candles to define a reversal, confirmation, or entry window. Write down exactly what each candle must prove before treating the phrase as a rule.
There is no single pattern with a reliable win rate across every market, timeframe, and rule set. Test a precise definition on the instrument and session you trade. Record the setup location, trigger, stop, target, costs, and outcome over a meaningful sample.
A possible bullish trend begins when price stops extending lower, starts holding higher lows, and breaks above short-term resistance. A candlestick pattern may flag the shift, but market structure and follow-through confirm whether buyers are actually taking control.
A dragonfly doji can support a bullish thesis after a decline when it rejects lower prices and receives follow-through. By itself, it shows that sellers lost control by the close. The next candle and the support context still matter.
Before entering, ask four questions: Where did the pattern form? What confirms it? Where is it wrong? Does the target justify the risk?
If those answers are clear, you have a defined setup. If they are not, wait. Missing one entry costs less than forcing a trade that never met your rules.
This article is for educational purposes only and is not financial advice. Futures trading involves substantial risk, and candlestick patterns can produce false signals.
.svg)


A gamma squeeze explained for futures traders: dealer hedging mechanics, the downside version, and how to manage the volatility without breaking account rules.


A workable crypto trading strategy defines the market condition, entry, invalidation, exit, position size, and daily risk limit before you place the trade.
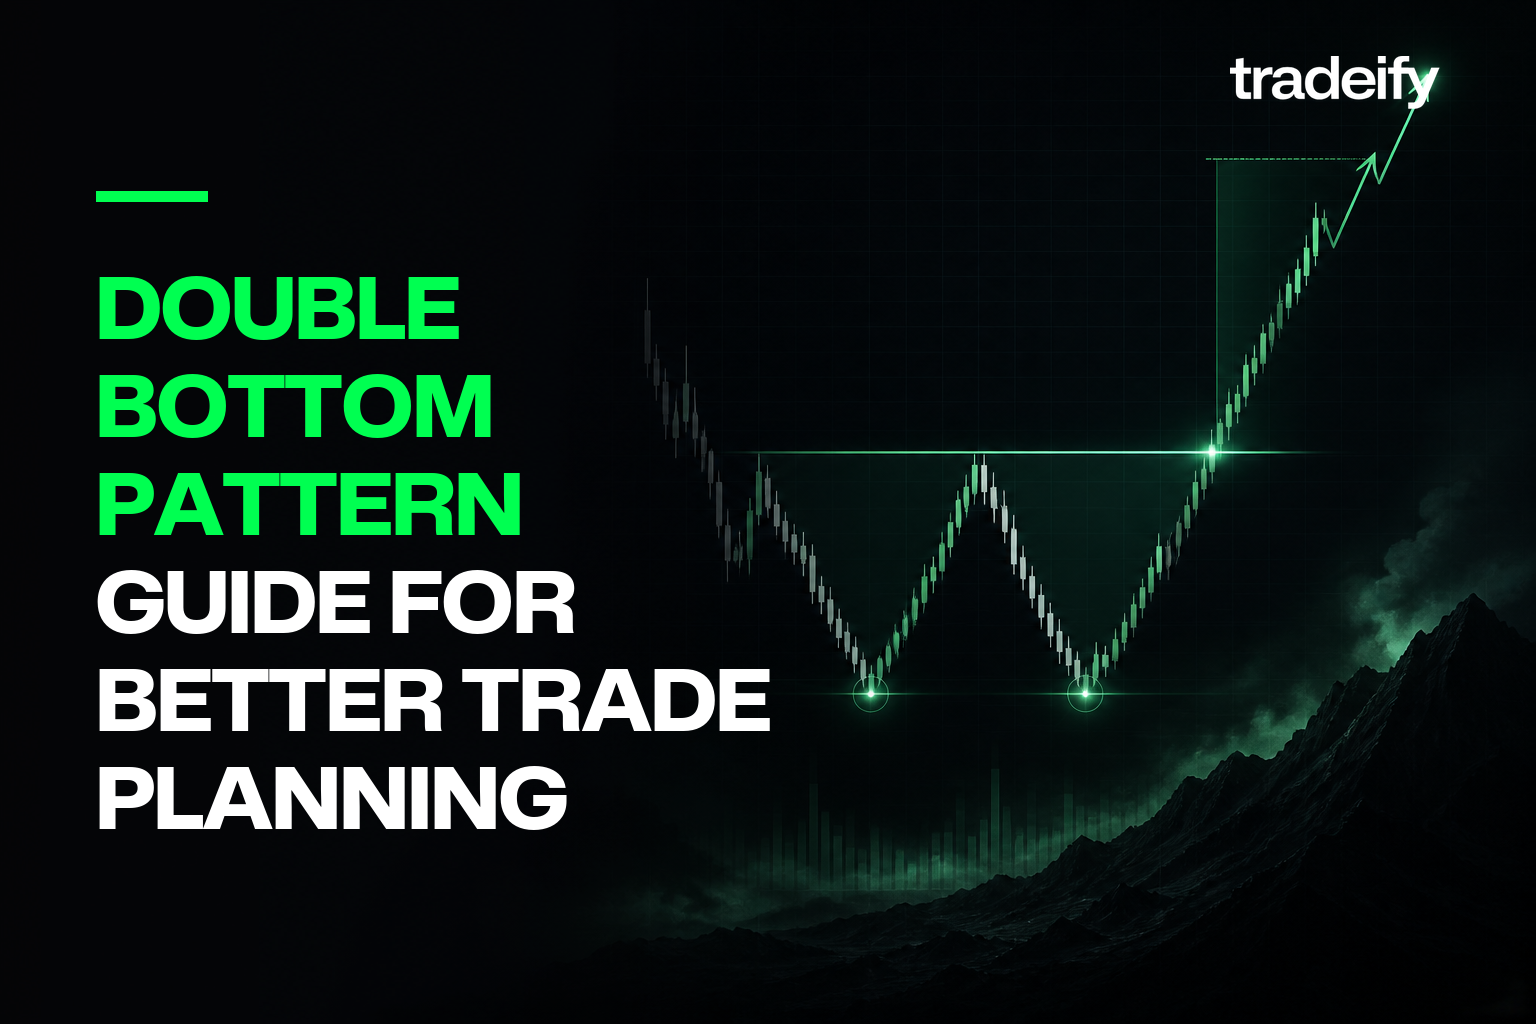
How to read a double bottom pattern, from the two support tests and neckline break to invalidation, measured moves, and position sizing for futures traders.

The ABCD pattern explained for futures traders, with the ratios that define the D zone, entry and invalidation rules, and how it compares with other formations.

How many trades a strategy backtest needs, why 100 is only a checkpoint, and how bias, costs, and market conditions affect sample reliability.

MES, MYM, and MCL are the Micro futures contracts that give beginners the best shot at passing a Tradeify Select or Growth prop firm evaluation.

.webp)








.svg)
.svg)
.svg)
