
.svg)
Tradeify 3.0 Is Here and Everything Just Changed
Tradeify 3.0 is here. New plans, new platforms, instant activations, and a massive Elite Live Performance Reward Pool. Everything just changed.

Best Ways to Get Mobile DOM Alerts for Futures Prop Trading
Learn the best ways to get mobile DOM alerts for futures prop trading. Master WealthCharts and Tradeify using bracket orders and real-time risk tools.

Futures Trading Strategies with Unusual Options Activity
Use unusual options activity in SPY and QQQ to predict ES and NQ futures moves. Learn a Tradeify workflow for entries, risk management, and passing evaluations.

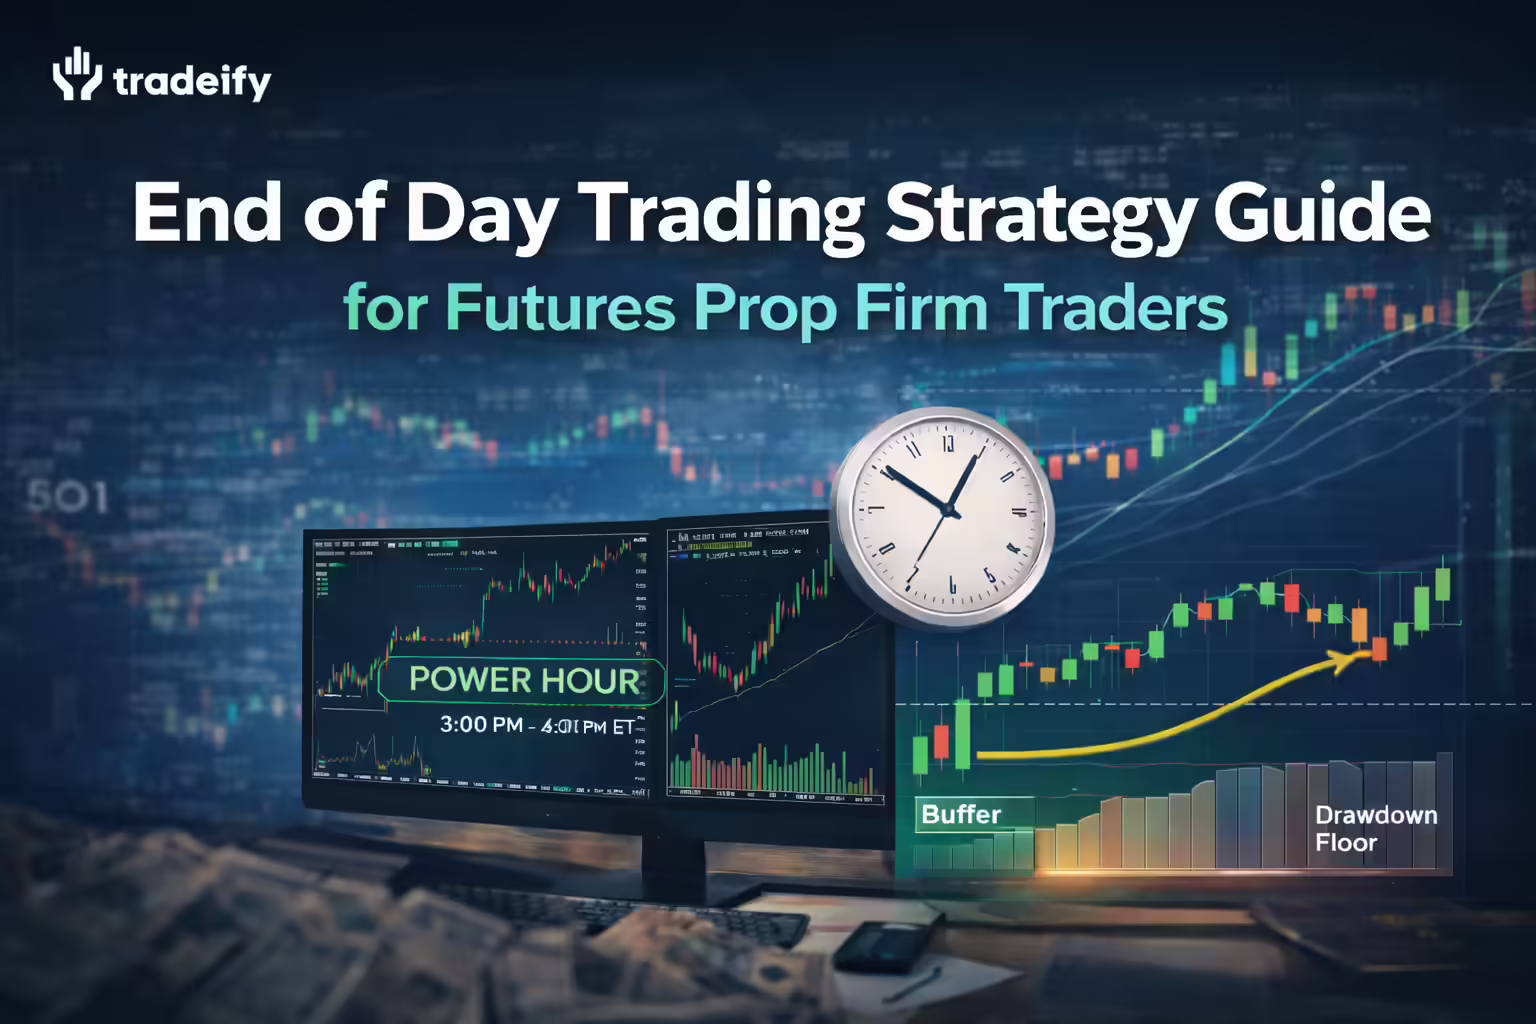
End of Day Trading Strategy Guide for Futures Prop Firm Traders
Learn how to trade futures at end of day with Tradeify by using Power Hour setups, exiting before 4:59 PM ET, and managing EOD trailing drawdown to protect your funded account.
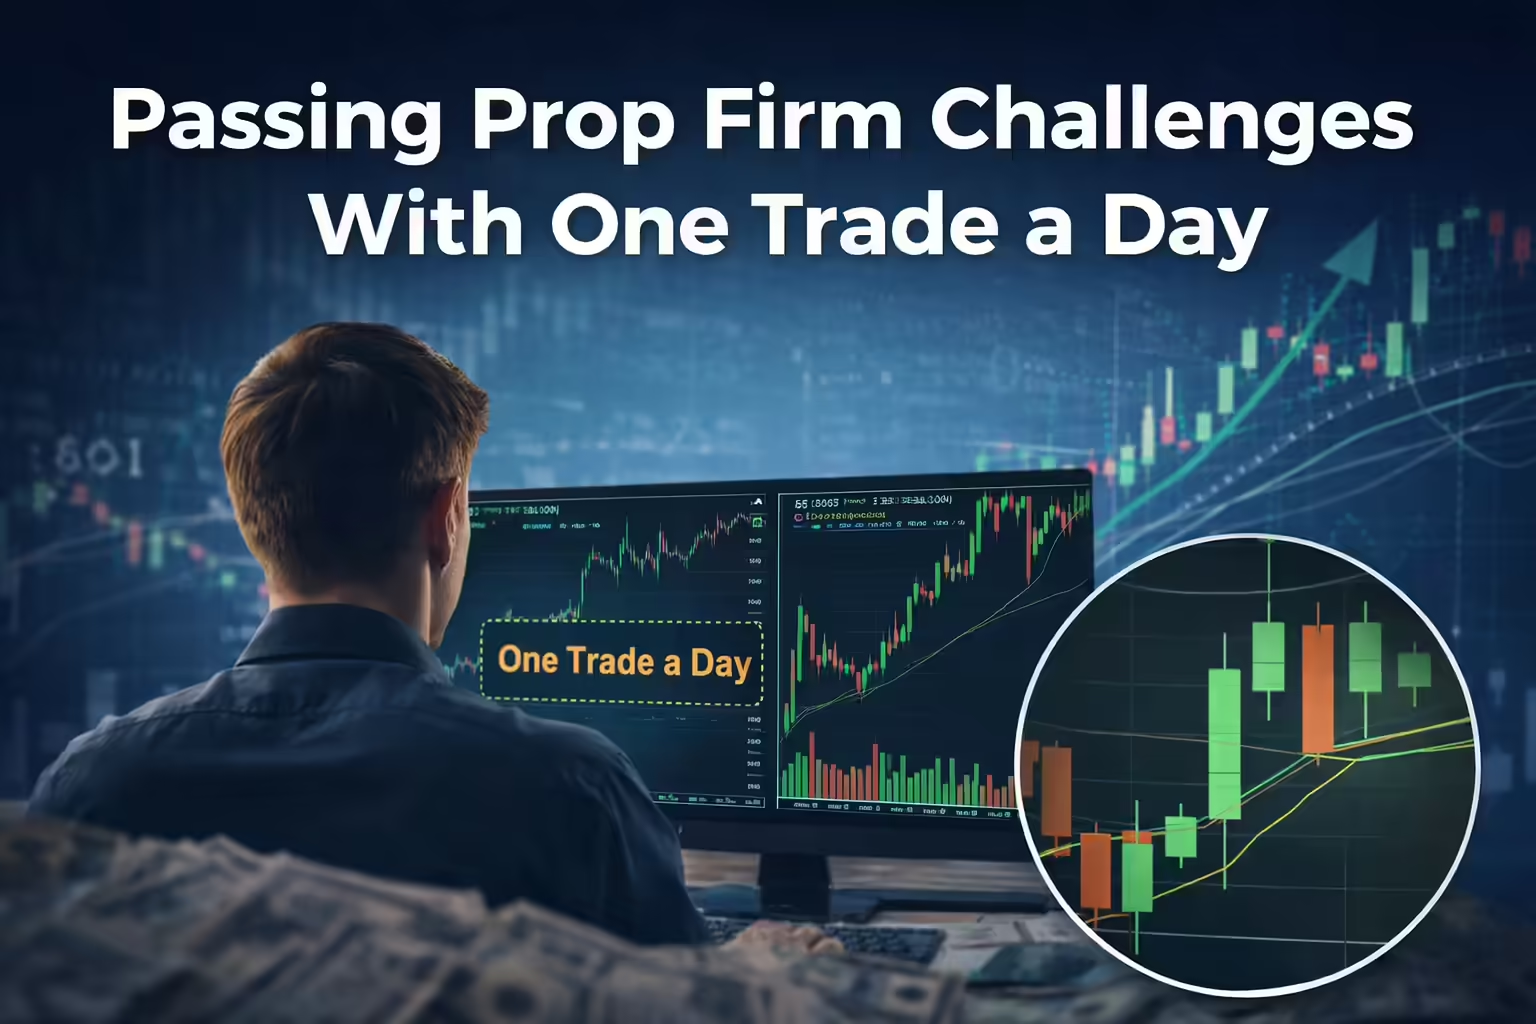
Passing Prop Firm Challenges With One Trade a Day
Pass your prop firm challenge using the One Trade a Day strategy. Stop overtrading, master consistency rules, and get funded with Tradeify.
Micro vs. Mini Futures Trading (Comparison & Strategy)
Struggling to pass your evaluation? Learn why starting with Micros to build a buffer—before transitioning to Minis—is the secret to surviving trailing drawdowns.

The Best Prop Firms That Allow Copy Trading in 2026
Can you copy trade with prop firms? Our 2026 guide covers the difference between internal and external copying, compliant software, and how to manage multiple accounts.

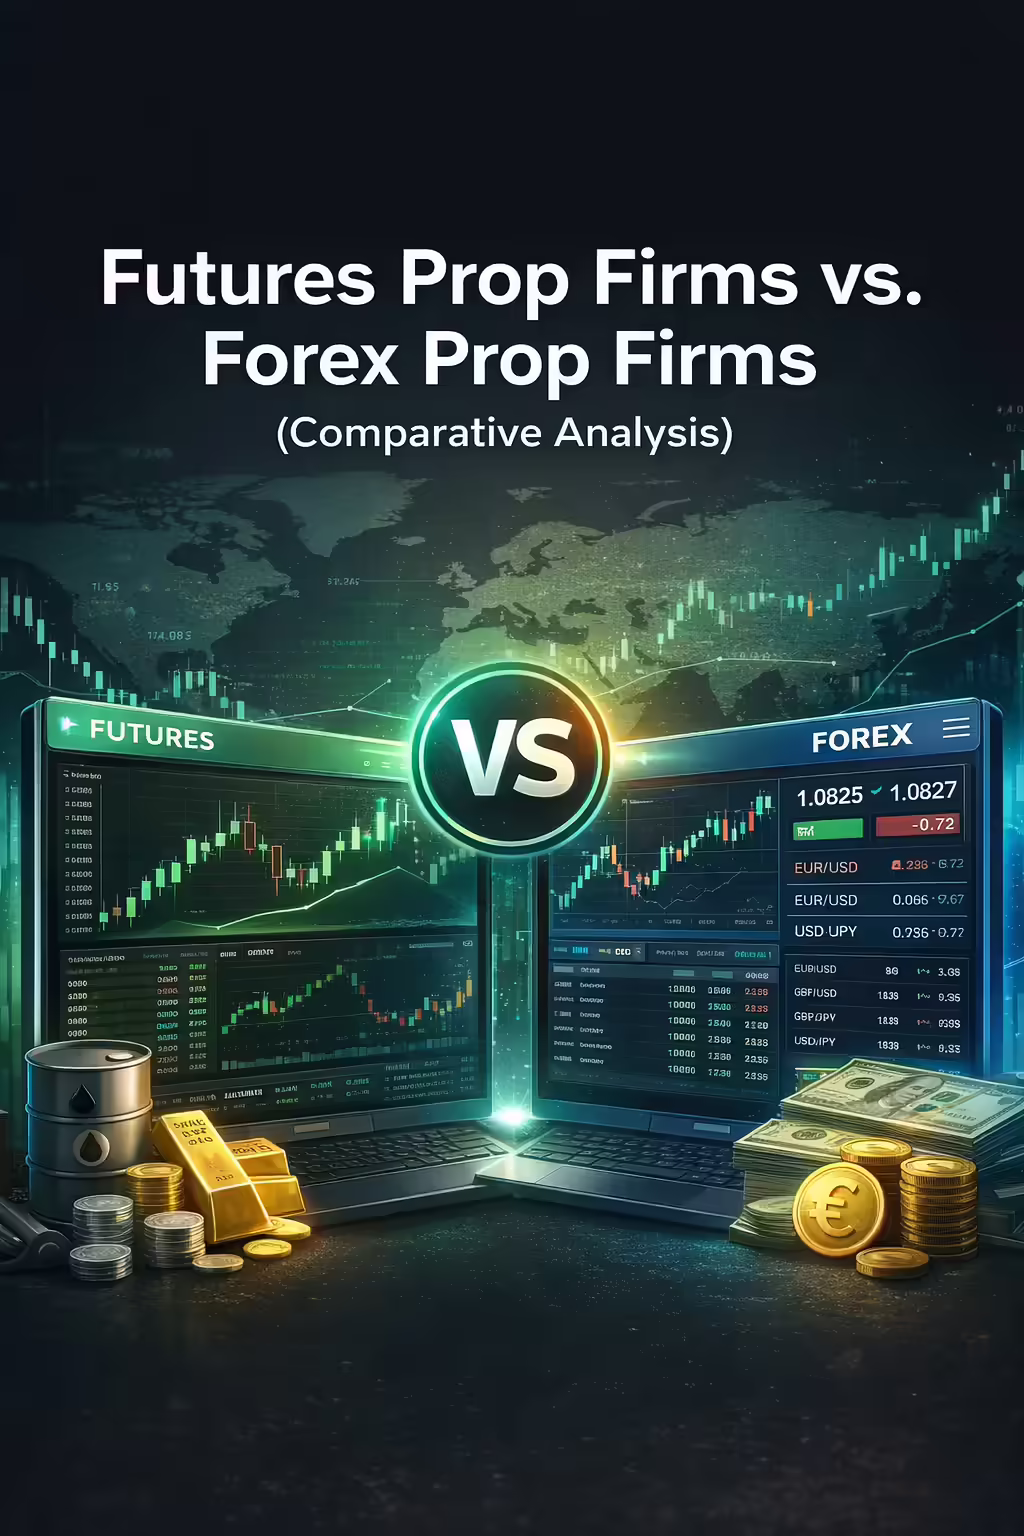
Futures Prop Firms vs. Forex Prop Firms (Comparative Analysis)
Futures vs. Forex Prop Firms: Why professional traders are switching to centralized futures in 2026. Compare regulations, hidden costs, and payout reliability.
Intraday Futures Volatility Analysis for Prop Firm Trading
Analysis of 13 years of intraday futures volatility data. Learn why NQ risks your funded account, how to trade the morning liquidity sequence, and when to sit out.

Smart Money Concepts Cheat Sheet for Prop Traders
Smart Money Concepts (SMC) cheat sheet for futures prop traders: liquidity sweeps, order blocks, fair value gaps, BOS/CHoCH, kill zones, SMT divergence, and Tradeify-specific rules for consistency, drawdown, and daily close.

Order Blocks in Trading and Smart Money Concepts
Master Order Blocks and Smart Money Concepts (SMC). Learn to identify institutional footprints, validate zones with displacement, and execute precise trades for prop firm success.

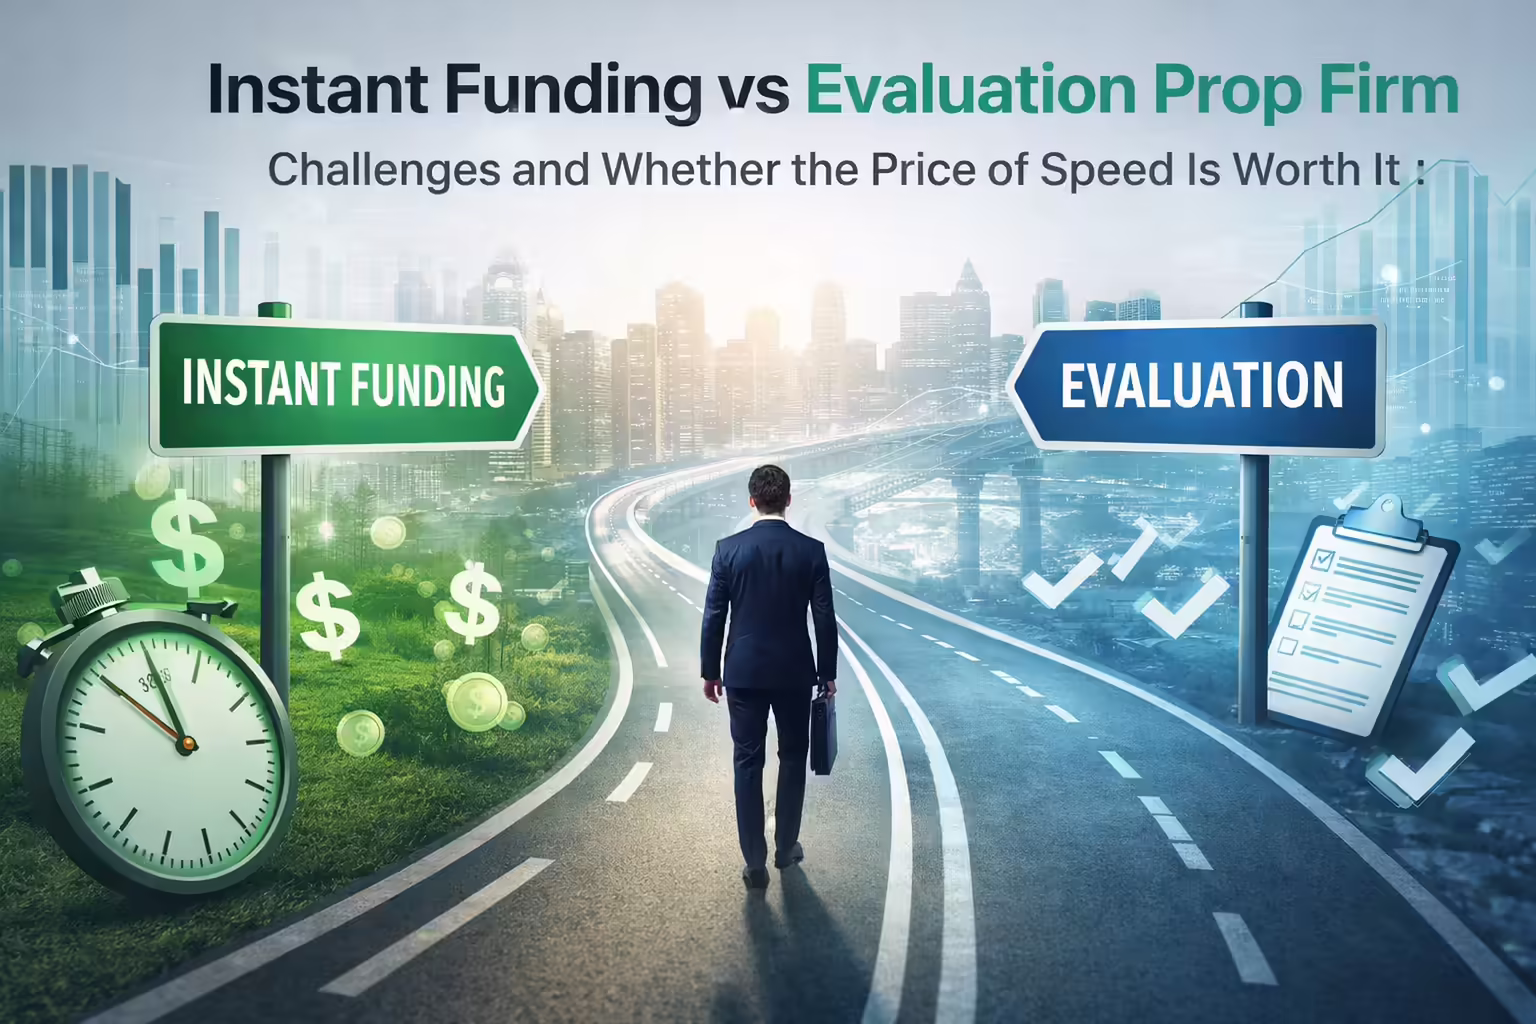
Instant Funding vs Evaluation Prop Firm Challenges and Whether the Price of Speed Is Worth It
Skip the test or prove your skills? Read our guide on instant funding vs evaluation to determine which prop firm model offers the smartest path to a funded account.
Best Futures Prop Firms for Beginners in 2026
New to futures prop trading? Learn which prop firms are best for beginners in 2026, with a clear breakdown of drawdown types, rules, and payout structures.

Prop Firms with the Fastest Payouts in 2026
Stop waiting for monthly paydays. Discover the best prop firms' funded trader programs offering daily withdrawals, instant processing, and the best liquidity velocity in 2026.

Best Affordable Futures Prop Firms of 2026
Discover the best affordable futures prop trading firms of 2026. This comprehensive report compares funding costs, activation fees, and risk rules like EOD drawdowns to help you find the highest value account for your trading style

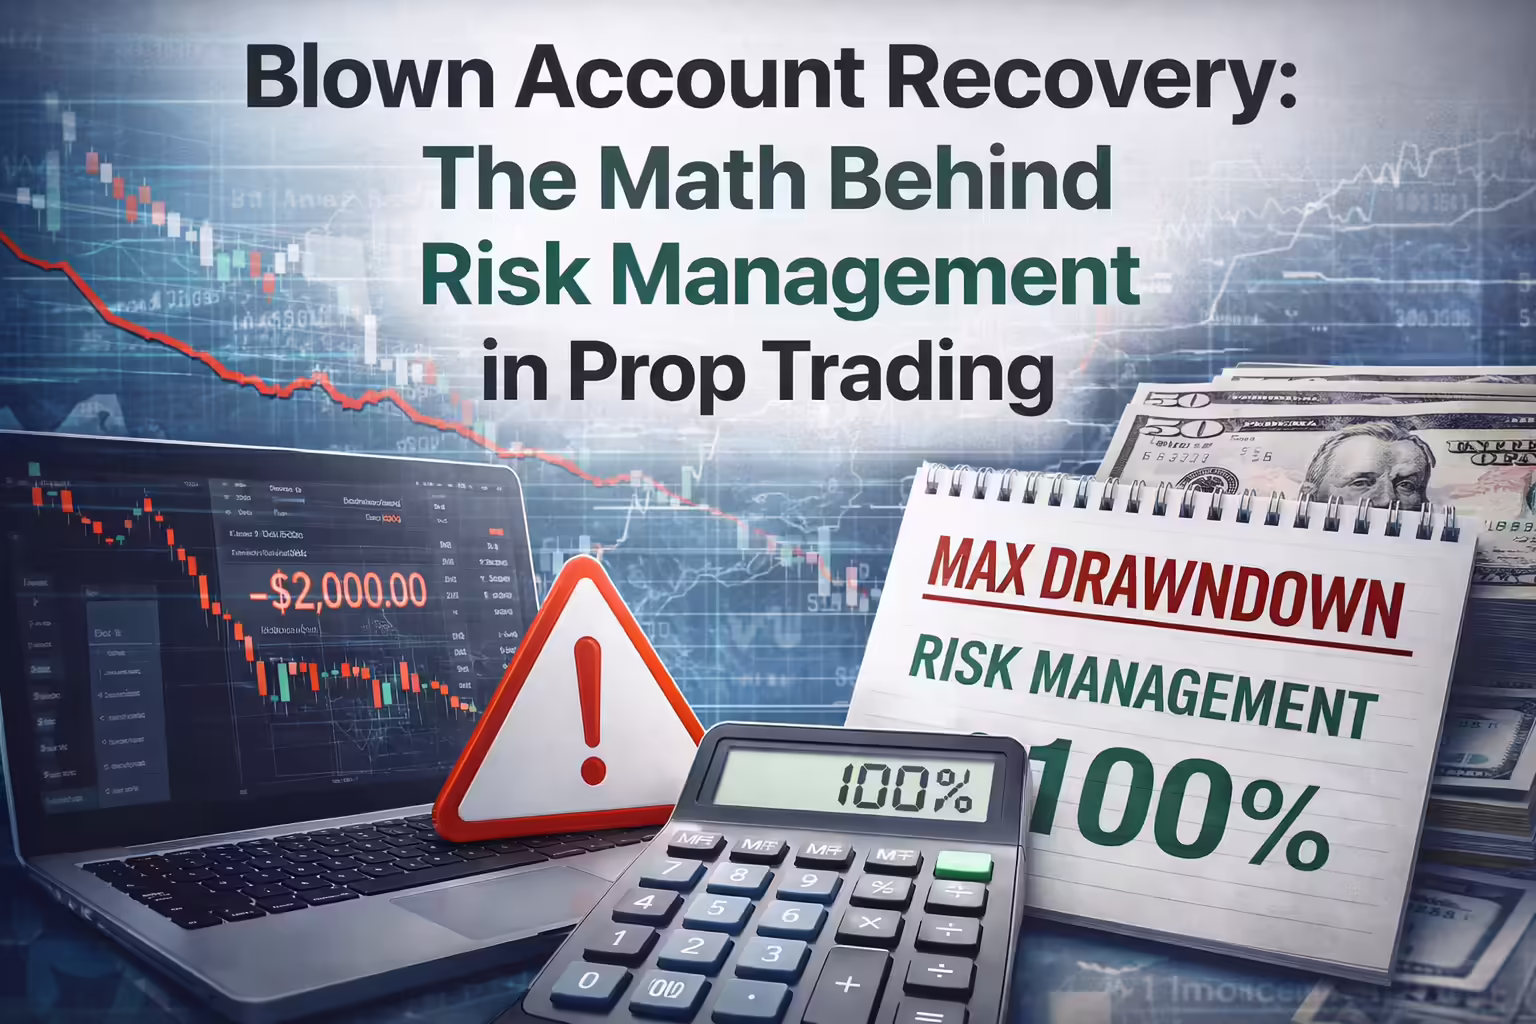
Blown Account Recovery: The Math Behind Risk Management in Prop Trading
Blew your prop firm account? It’s not just psychology; it’s statistics. Learn the math behind drawdown recovery and the exact position sizing needed to survive.
Funded Trader Psychology and Handling the Shift from Sim to Live
Master funded trader psychology and the shift from sim to live. Learn to handle prop firm drawdowns, overcome anxiety, and build a resilient trading mindset.

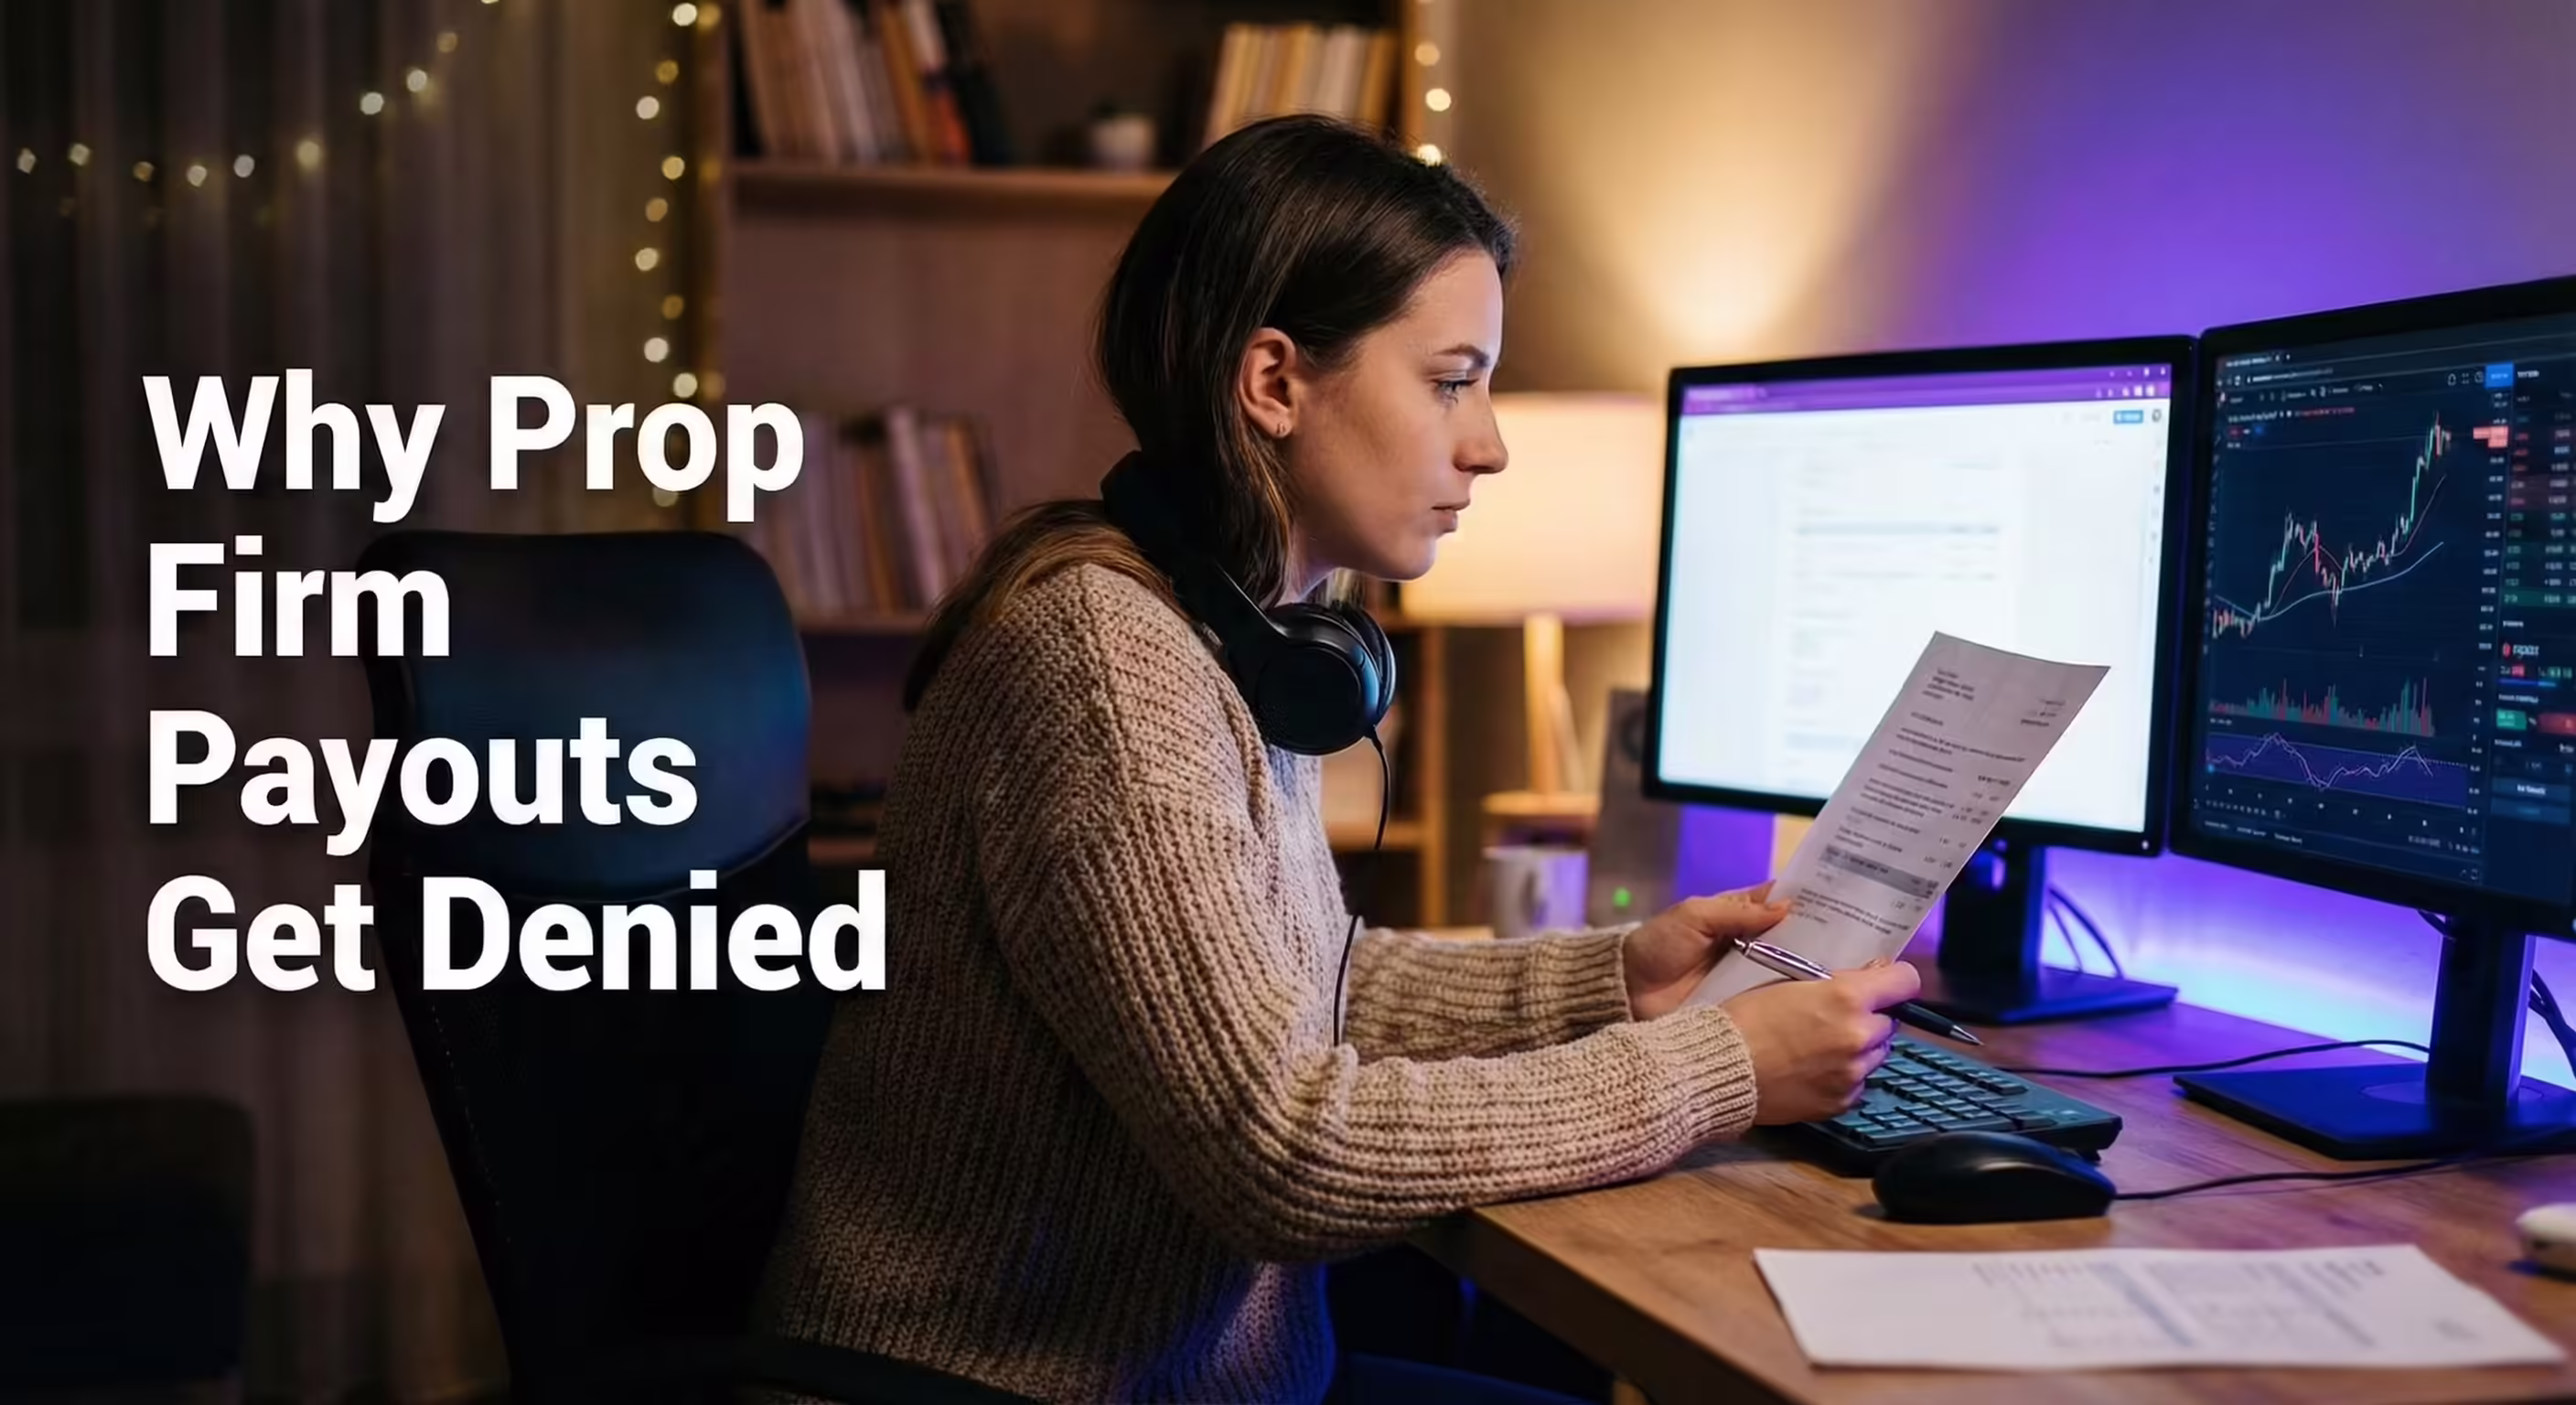
Why Prop Firm Payouts Get Denied: 7 Red Flags Traders Miss (And How to Avoid Them)
Why do prop firm payouts really get denied? We uncover the vague terms, prohibited strategies, and support warning signs you need to know before you trade.
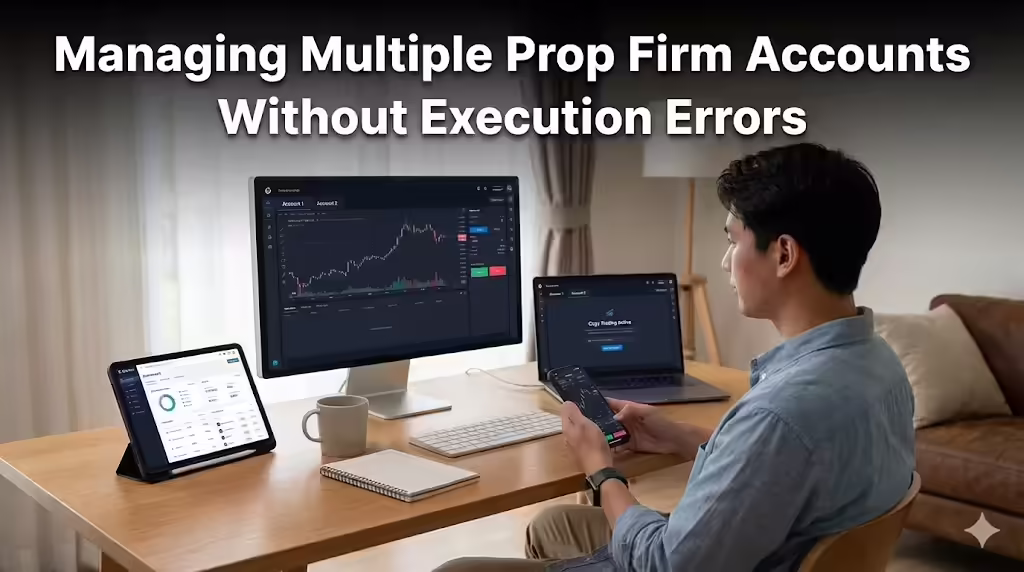
Managing Multiple Prop Firm Accounts Without Execution Errors
Master the art of trading multiple prop firm accounts simultaneously. Learn essential copy trading strategies, avoid critical execution errors, and scale your profits without technical risks.
10 Proven Futures Trading Strategies to Pass Prop Evaluations
Struggling to pass prop firm challenges? Discover 10 expert futures strategies, strict rule breakdowns, and risk management tips specifically for Tradeify.

Futures Trading for Beginners: A Step-by-Step Guide to Your First Futures Account
Futures Trading for Beginners: A Step-by-Step Guide to Your First Futures Account

%201.png)
Join our Discord community
Win exclusive prizes, get the latest news and improve with likeminded traders.
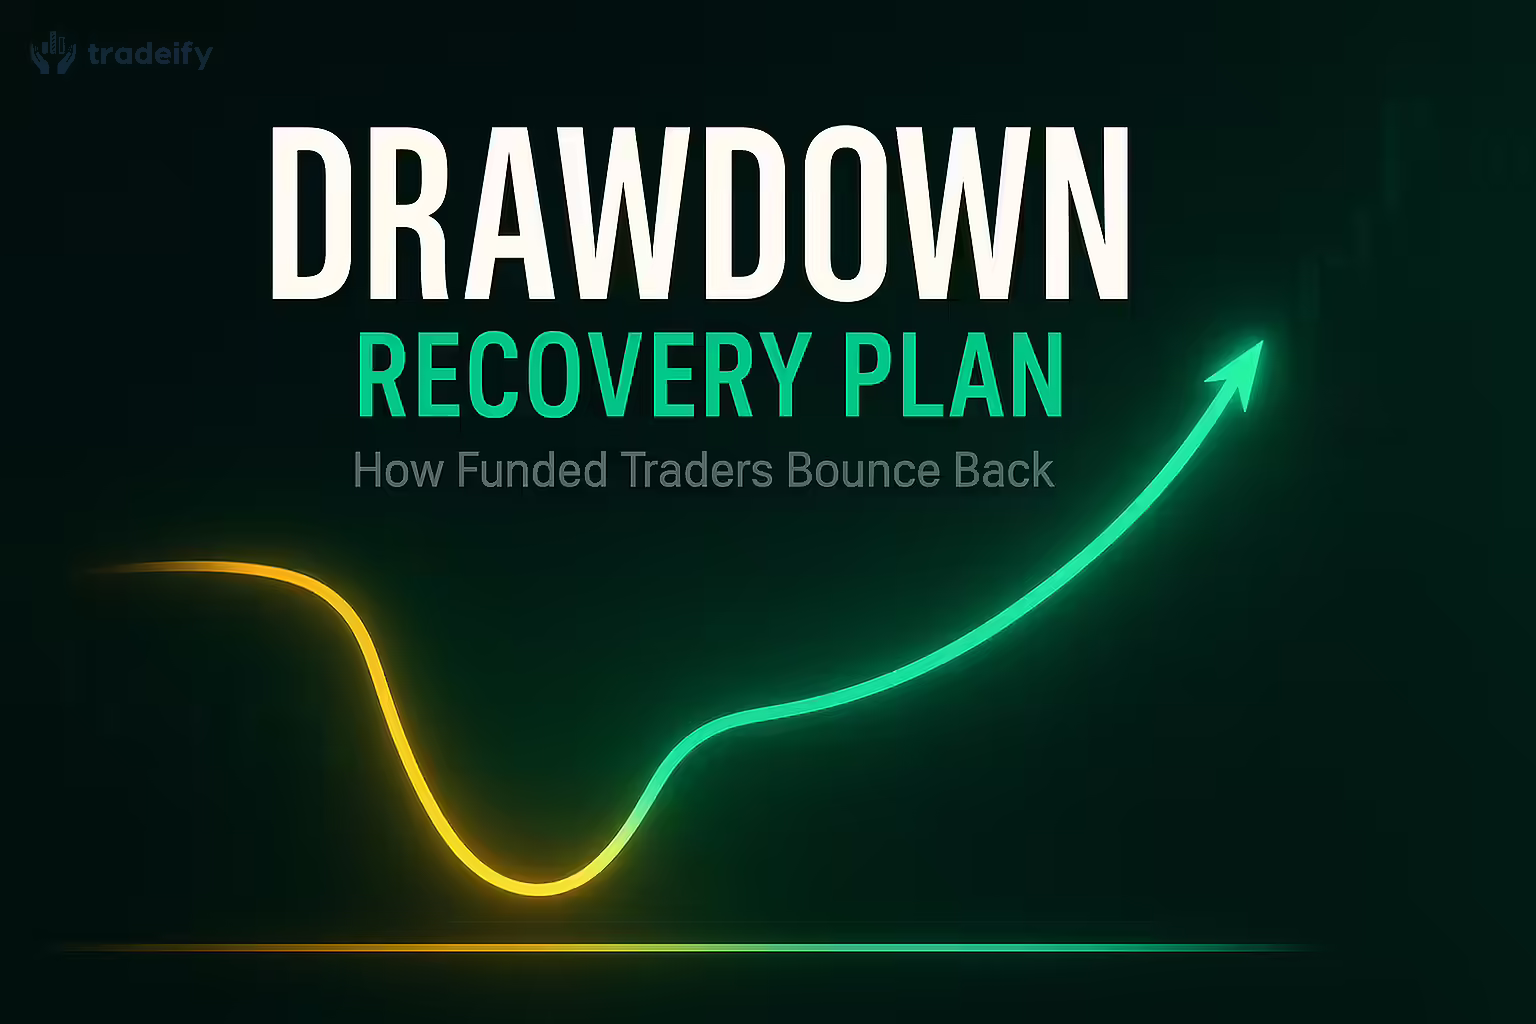

Learn how to recover from prop firm drawdowns with a structured three-phase plan covering psychological resets, trade audits, risk scaling, and EOD drawdown mechanics.

Prop trading firms like Tradeify give futures traders access to $50K–$150K in simulated buying power for fees starting under $100 per month..
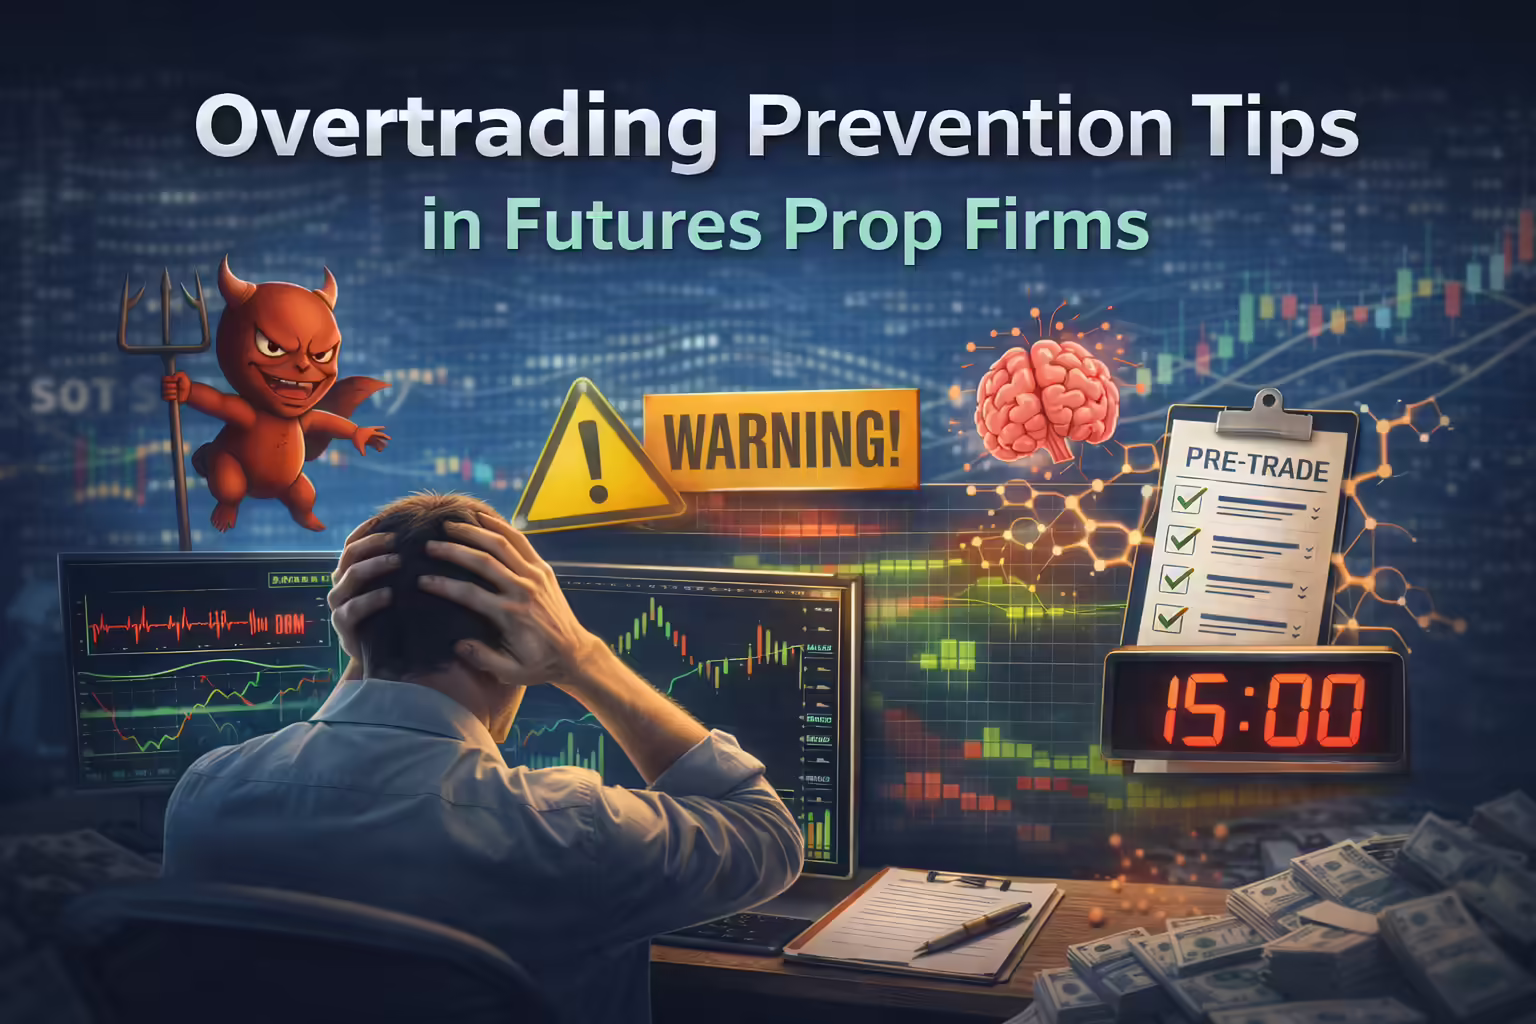
Learn how to stop overtrading in futures with Tradeify by spotting emotional triggers, managing EOD trailing drawdown risk, using Daily Loss Limits, and applying practical rules that protect funded accounts.
10x your trading with up to $750k simulated funds
- Free built-in journal

- Get Instant Funding, or take an Evaluation
- Automated payouts
.webp)
