
Brett is a seasoned day trader with over eight years of experience in the financial markets.He is the Founder and CEO of Tradeify Funding, a platform offering instant funded trading accounts to traders seeking capital.
Introduction
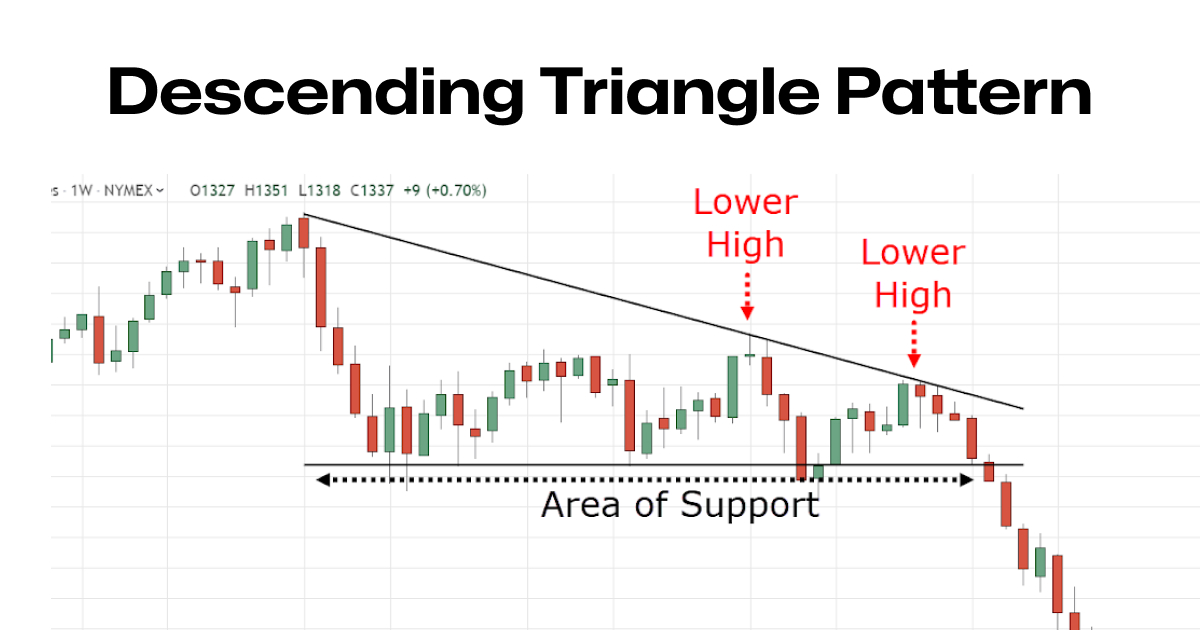
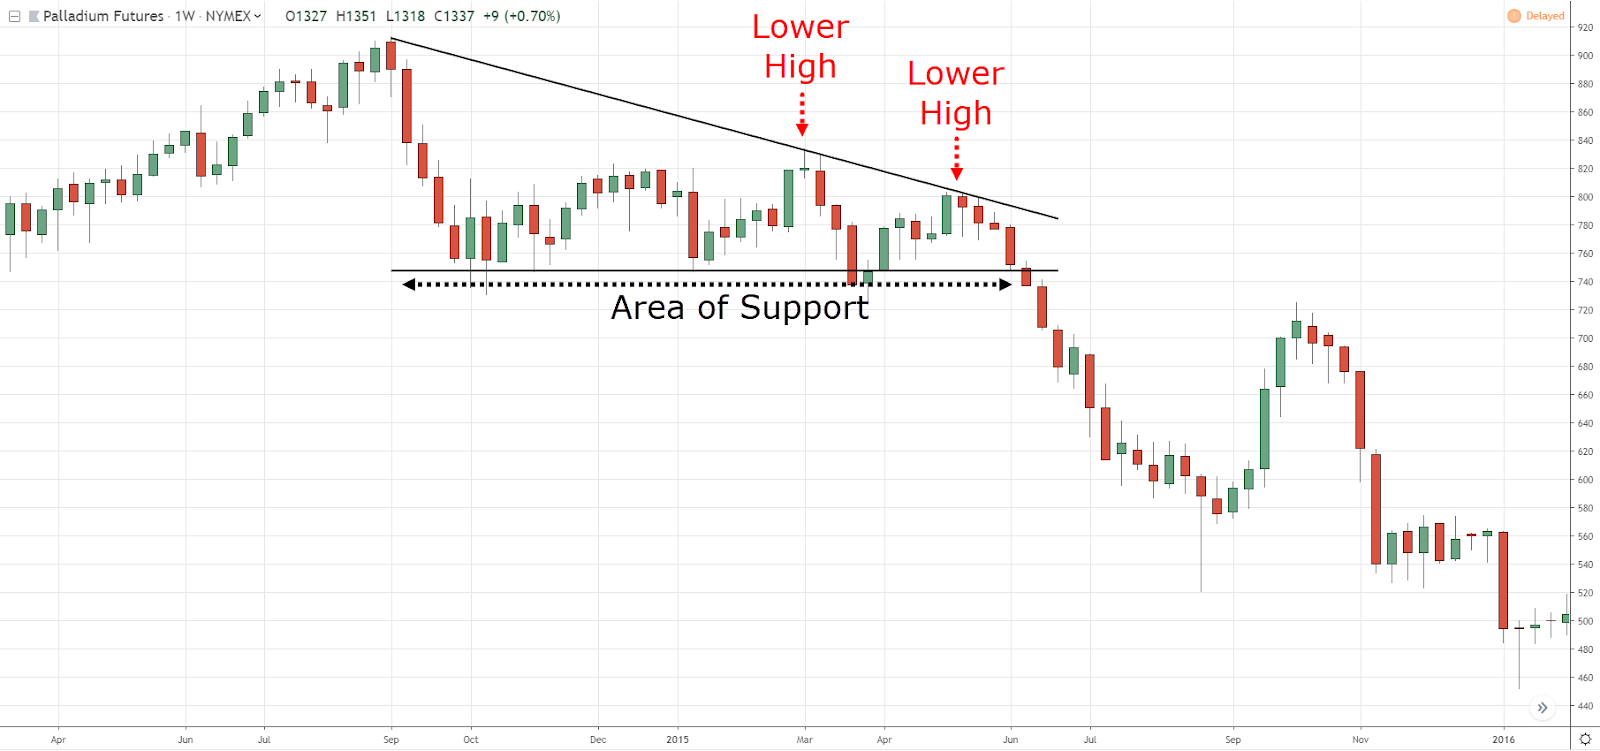
People always wonder how to make profits during bearish markets and instability - one way is by spotting and utilising the Descending Triangle Pattern. This pattern is one of the most reliable chart patterns used in technical analysis. Often it signals a potential bearish continuation, making it valuable for traders looking to short the market. In this guide, we explain what the descending triangle pattern is, how to spot it, and strategies to profit from it.
The descending triangle pattern is formed when a downward-sloping trendline meets a flat support level. Here are the key characteristics:
- Lower Highs: The upper trendline connects a series of lower highs.
- Horizontal Support: A flat support line runs along the lows, indicating a level where buyers step in consistently.
- Volume Trends: Volume may decline as the pattern develops, and a spike often confirms the breakout.
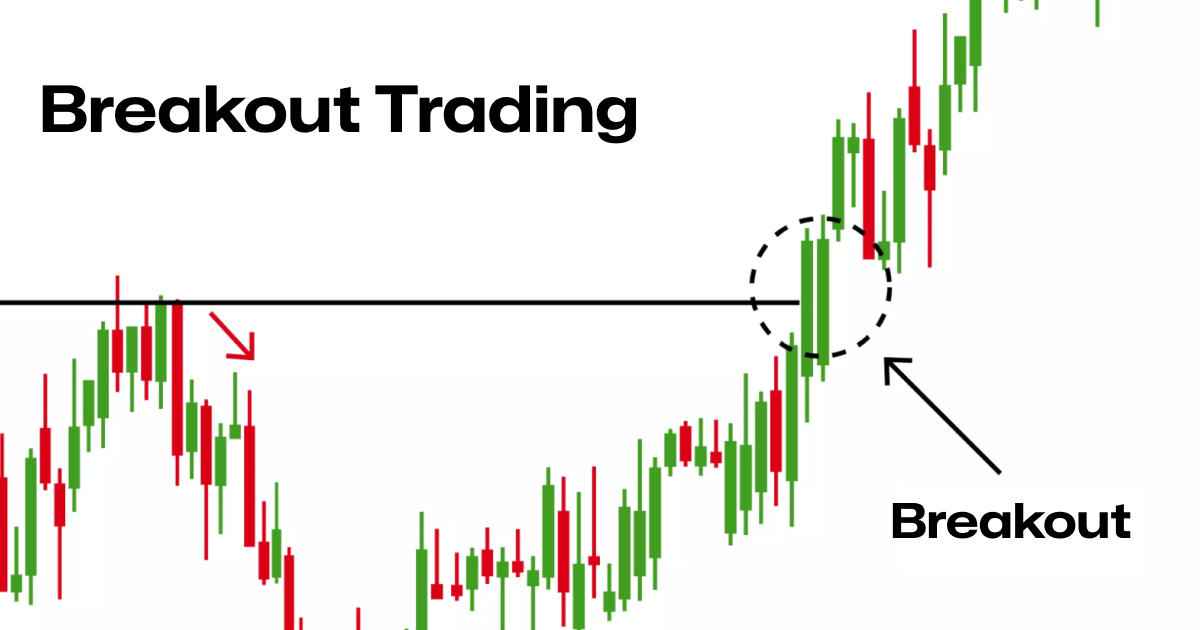
When the price breaks below the horizontal support, it signals that sellers have taken control. However, sometimes the pattern may lead to a false breakout or a temporary pause. That’s why understanding its nuances is crucial.
*Picture just for visualisation
How to Spot the Descending Triangle Pattern
Spotting the descending triangle pattern involves a keen eye for chart details. Follow these steps to identify the pattern:
✅Look for Lower Highs:
Scan your chart for a series of lower highs. The more points that align, the more reliable the trendline becomes.
✅ Identify Flat Support:
Check for a horizontal line at the bottom of these highs. This line acts as a support level where buyers have consistently entered the market.
✅Volume Confirmation:
Notice if the volume tapers off during the formation of the pattern. A sudden increase in volume at the point of a breakout is a strong confirmation signal.
✅ Time Frame Consideration:
Ensure that the pattern spans a significant period. Patterns that form over multiple sessions or days tend to be more reliable.
✅ Use of Technical Tools:
Utilize charting tools available on platforms like Tradeify to draw trendlines and identify support levels accurately. Advanced analytics can help you spot even subtle formations.
By following these steps, you can confidently identify a descending triangle pattern. Practice spotting this formation on historical charts before applying it in live trading.
Strategies to Profit from the Descending Triangle Pattern
Once you’ve identified the descending triangle, the next step is to develop a trading strategy. Here’s how you can profit from it:
- Plan Your Entry:
Wait for the price to break below the horizontal support line. A confirmed break, especially on high volume, signals that the bearish trend is likely to continue.
Consider entering a short position immediately after the breakout. Some traders prefer a “wait and see” approach, waiting for a retest of the support line before entering a trade. - Set Your Stop-Loss:
Always protect your capital. Place a stop-loss order above the descending trendline or near the breakout point. This strategy helps limit losses if the market moves against your position.
A common practice is to set the stop-loss 1-2% above the breakout level. This small buffer can shield you from false breakouts or market noise. - Determine Your Profit Target:
Measure the vertical distance between the horizontal support and the first high of the triangle. Project this distance downward from the breakout point to set a profit target.
For example, if the vertical distance is $5, set your target roughly $5 below the breakout level. This method provides a clear risk-reward ratio. - Confirm with Volume:
Trade only when volume confirms the breakout. A surge in volume at the breakout suggests that the move is genuine and increases the probability of a successful trade. - Consider Partial Exits:
If the trade moves in your favor, consider taking partial profits along the way. This approach locks in gains while allowing you to ride the trend for a larger move.
Practise your skills and start investing by Joining Tradeify Today
Risk Management and Trading Tips
Even the most reliable patterns can fail. Effective risk management is essential. Here are a few tips:
- Stick to Your Trading Plan:
Define your entry, stop-loss, and profit target before placing the trade. Following your plan reduces emotional decision-making. - Manage Your Position Size:
Avoid risking too much on a single trade. Many professionals risk only 1-2% of their trading capital per trade. - Monitor Market Conditions:
A descending triangle pattern works best in a bearish or neutral overall market. Ensure that other market indicators support the bearish bias. - Use Technical Tools:
Platforms like Tradeify offer advanced charting and analytics that help you set precise entries and exits. These tools can enhance your trading discipline. - Review and Learn:
Keep a trading journal documenting each trade, including your reasoning and the outcome. Over time, this review process can highlight areas for improvement. - Prepare for False Breakouts:
Sometimes the price may briefly move below support and then reverse. Be prepared for this possibility by watching for a confirmation of the breakout with higher volume.
Leveraging Tradeify’s Tools for Better Trading
Tradeify provides a suite of advanced tools and analytics that can help you spot and trade patterns like the descending triangle. Their platform offers:
🚀 Real-Time Charting:
Access real-time charts with customizable indicators to identify descending triangles accurately.
🚀 Advanced Analytics:
Use in-depth analytics to measure the pattern’s dimensions, helping you set precise profit targets and stop-loss levels.
🚀 Educational Resources:
Learn more about various chart patterns, including the descending triangle, through Tradeify’s educational materials. This knowledge can be invaluable in refining your trading strategy.
🚀 Community Support:
Engage with a community of like-minded traders. Sharing insights and strategies can help you learn and grow faster.
By leveraging these tools, you can improve your technical analysis skills and increase your chances of success when trading descending triangles.
Final Thoughts
The descending triangle pattern is a powerful tool for traders, especially in bearish market conditions. Its clear formation—with lower highs and a flat support line—provides actionable signals for entering short positions. However, as with any trading strategy, success depends on careful analysis, proper risk management, and continuous learning.
To profit from the descending triangle pattern, focus on accurate pattern identification, volume confirmation, and well-planned entries and exits. Set clear stop-loss orders and profit targets to protect your capital and maximize gains. Remember, even the most reliable pattern can produce false signals, so maintain discipline and always manage your risk carefully.
Trading with platforms like Tradeify, which offer advanced tools and a supportive community, can further enhance your ability to spot and trade these patterns effectively. Embrace the challenge, refine your strategy, and make informed decisions. With dedication and practice, you can turn the descending triangle pattern into a profitable part of your trading toolkit.
Start applying these strategies today and watch your trading skills grow.
Discover more insights and tools with Tradeify, and take your technical analysis to the next level 🚀
.svg)
.svg)
.svg)


.webp)
