
Popularized by William O’Neil, this pattern helps traders spot opportunities in stocks, forex, and futures markets. Recognizing it can add an engaging edge to your trading strategy by highlighting key entry points.
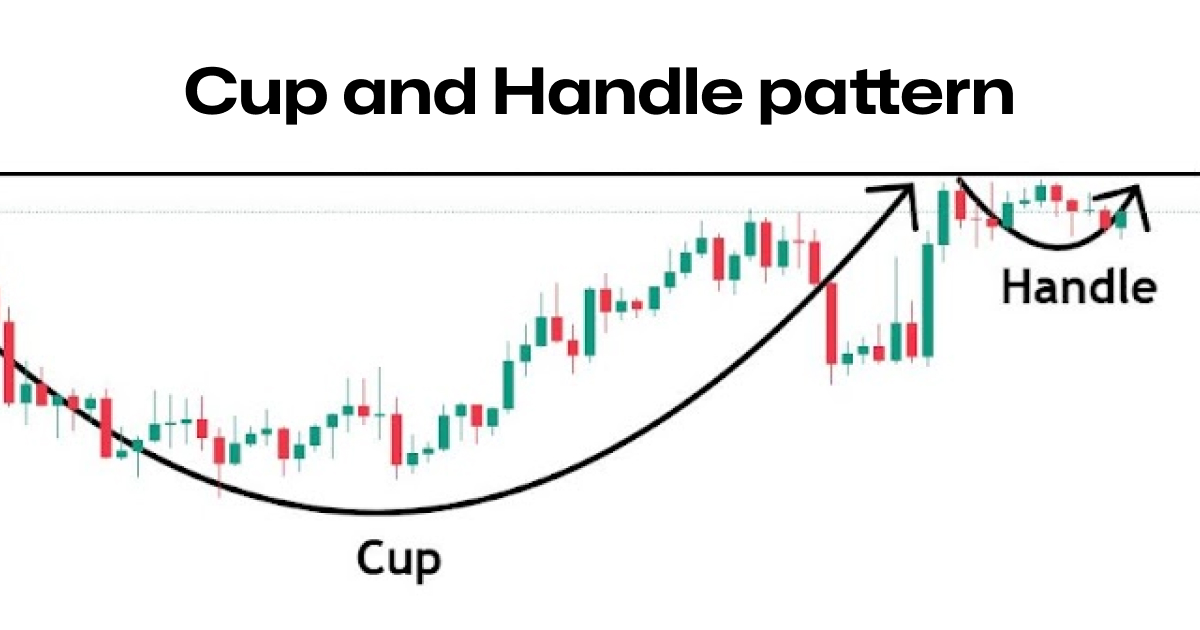
How does the Cup and Handle Pattern look?
The bullish continuation setup that resembles a tea cup when plotted on a price chart consists of two main parts:
- The Cup – A U-shaped price formation that signals a period of consolidation before an uptrend.
- The Handle – A small pullback or sideways movement after the cup forms, which builds pressure for the breakout.
Once the price breaks above the handle’s resistance level, it often triggers a strong rally, making this pattern a favorite among traders.
The cup and handle pattern is most commonly found in stocks, but it also works well in forex and futures trading—a key reason why many traders at Tradeify use it in their funded accounts.
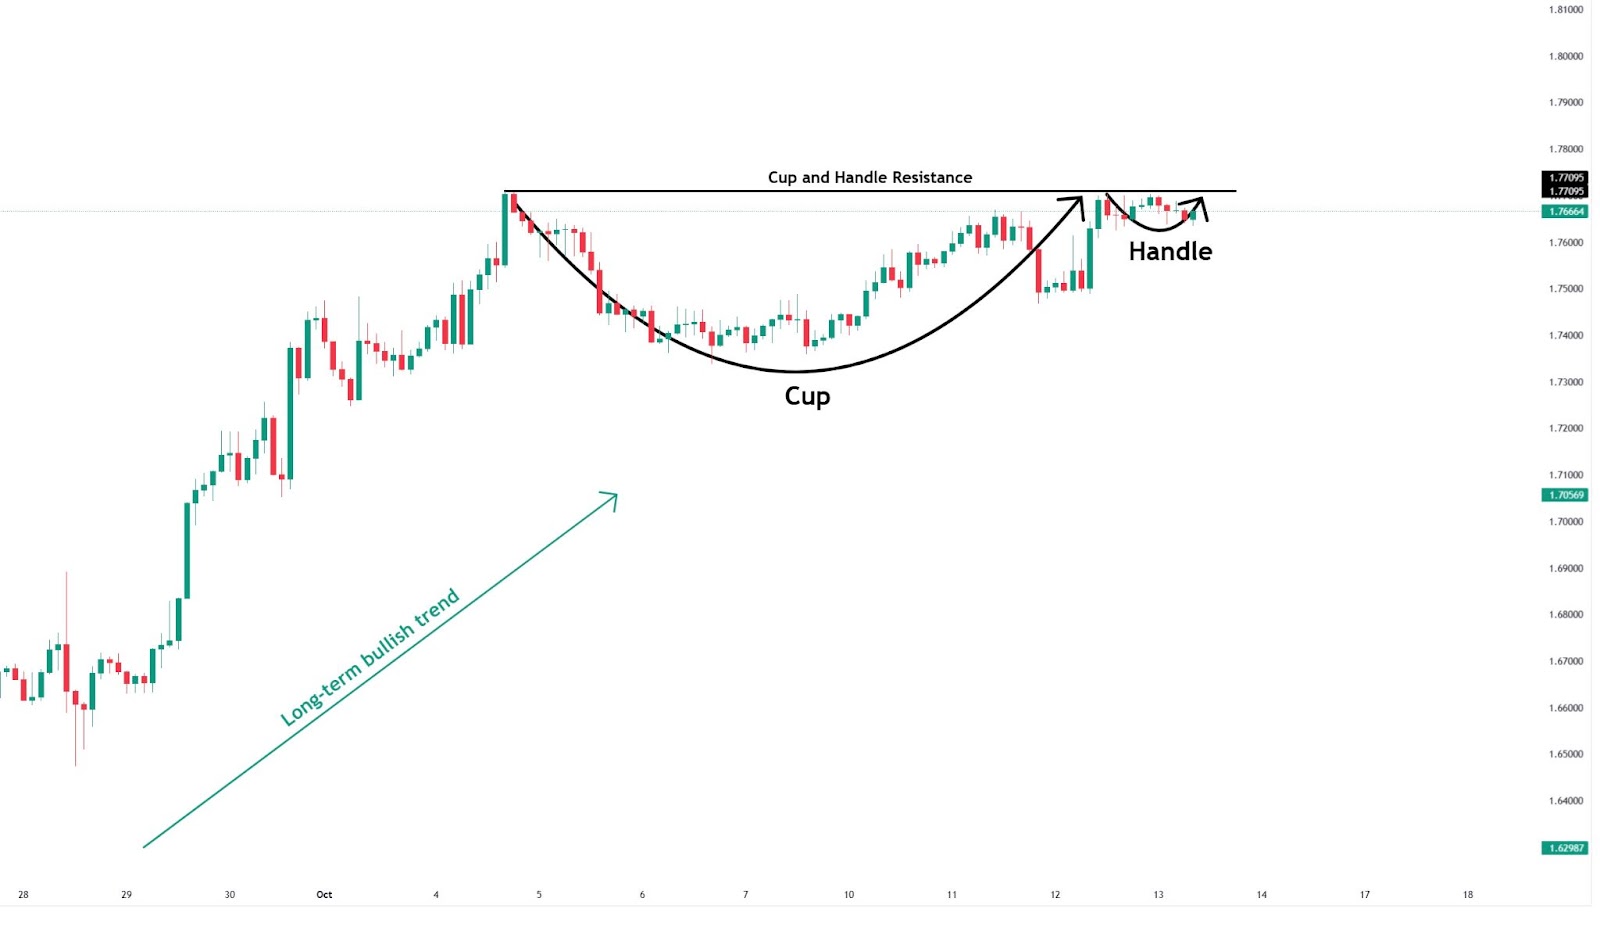
Example of the Cup and Handle in Action
Let’s say a stock forms a cup with a bottom at $50 and a resistance level at $60. After the stock rises back to $60, it pulls back slightly to $58, forming the handle.
If the price then breaks above $60 with strong volume, it signals a potential bullish breakout, making it a great entry for traders.
How to Identify the Cup and Handle Pattern
To trade the cup and handle pattern effectively, you first need to identify it correctly. Here’s what to look for:
✅ A Rounded Bottom (The Cup) – A smooth, U-shaped dip in price that signals a period of accumulation. Avoid V-shaped bottoms, as they tend to be less reliable.
✅ A Pullback (The Handle) – A slight dip (or sideways movement) that forms after the cup. This should be relatively shallow, staying within 30–50% of the cup’s height.
✅ Breakout Point – A resistance level at the top of the handle. A strong breakout above this level is the ideal entry point.
Example of the Cup and Handle in Action
Let’s say a stock forms a cup with a bottom at $50 and a resistance level at $60. After the stock rises back to $60, it pulls back slightly to $58, forming the handle.
If the price then breaks above $60 with strong volume, it signals a potential bullish breakout, making it a great entry for traders.
Try it out yourself - Join Tradeify Today!
How to Trade the Cup and Handle Pattern Effectively
Step 1: Wait for Confirmation
Don’t jump in too early. The safest entry is when the price breaks above the handle’s resistance with strong volume. This confirms that buyers are in control.
Step 2: Set Your Entry Point
A buy order should be placed just above the breakout level. This ensures you enter the trade only if the pattern plays out correctly.
Step 3: Place a Stop-Loss Order
To protect against false breakouts, set a stop-loss below the lowest point of the handle or 5-10% below the breakout level. This minimizes risk.
Step 4: Set a Profit Target
A common profit target is to measure the depth of the cup and add it to the breakout level.
📌 Example: If the cup’s lowest point is $50 and the breakout level is $60, the target would be $70 ($60 + $10).
Step 5: Manage Risk and Take Profits
If the price moves in your favor, consider scaling out of your position or trailing your stop-loss to lock in profits.
Common Mistakes to Avoid
🚫 Entering Too Early – Always wait for a confirmed breakout to avoid getting trapped in false moves.
🚫 Ignoring Volume – A strong breakout should be supported by high trading volume. Low volume breakouts are more likely to fail.
🚫 Using Tight Stop-Losses – A stop-loss that’s too close to the entry can get triggered prematurely by normal market fluctuations.
🚫 Forgetting Market Conditions – The cup and handle pattern works best in bullish markets. If the overall trend is weak, the breakout may struggle.
Trading the Cup and Handle with a Prop Firm Like Tradeify
If you’re trading with a prop firm like Tradeify, using the cup and handle pattern can be a smart way to manage risk while maximizing profits.
Why Use a Prop Firm?
✅ Trade with More Capital – With a funded account, you can take larger positions without risking personal funds.
✅ Access to Futures Markets – Many Tradeify prop firm futures traders use this pattern to trade commodities and indices.
✅ Risk Management Rules – Tradeify helps traders stay disciplined by enforcing smart risk management strategies.
By following a structured approach, traders can use the cup and handle pattern effectively to grow their accounts and qualify for higher funding levels.
Final Thoughts
The cup and handle pattern is a powerful bullish breakout strategy that works across multiple markets, from stocks to futures. By waiting for confirmation, managing risk properly, and avoiding common mistakes, traders can use this pattern to identify high-probability trade setups.
For those looking to take their trading to the next level, trading with a prop firm like Tradeify can provide access to larger capital, futures trading opportunities, and structured risk management—all essential for long-term success.
🚀 Ready to put the Cup and Handle pattern to work?
👉 Start trading with Tradeify today!
.svg)
.svg)
.svg)


.webp)

